Happiness and Health
The General Social Survey, which asks people about a wide variety of social issues, just released their data for 2018. Among the the questions asked are about happiness (very happy, pretty happy, or not too happy) and health condition (excellent, good, fair, and poor). Here’s how the latter tends towards the former.
General Happiness by Health
As health declines, so does happiness, based on responses to the GSS.

HEALTH
Excellent
Good
Fair
Poor
23%
50%
22%
5%
Not Too Happy
Almost half not too happy.
Pretty Happy
Very Happy
Source: General Social Survey 2016 and 2018

HEALTH
Excellent
23%
Very
Happy
Pretty
Happy
Not Too
Happy
Good
50%
Fair
22%
Poor
5%
Almost half not too happy.
Source: General Social Survey 2016 and 2018
If only there were a way to keep more people healthy. That would be nice.
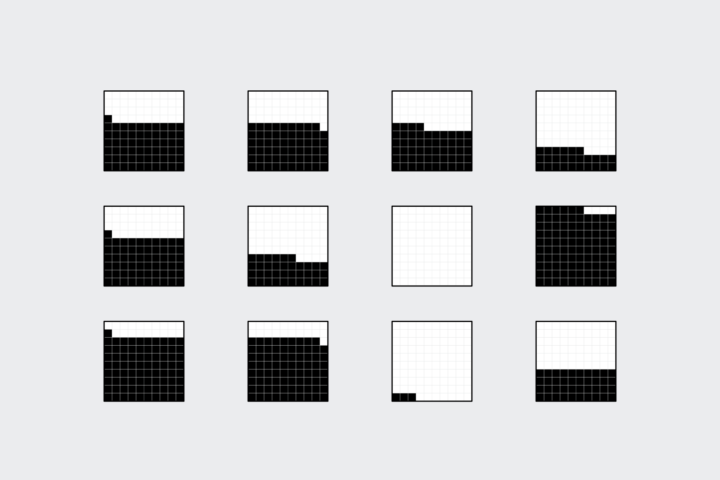
How to Make Square Pie Charts
A bit easier to read than their circular sibling.
Become a member. Support an independent site. Make great charts.
See What You GetFlowingData is made possible by supporting members. Since 2007, I, Nathan Yau, a real person, have been analyzing and visualizing data to help more people understand and appreciate it in their everyday lives.
If you liked this or want to make similar data things, please consider supporting this small corner of the internet. You get unlimited access to visualization courses, tutorials, and extra resources. Thanks. — Nathan
Chart Type Used
