After Marriage, How Long People Wait to Have Kids
When a couple gets married, they are almost always faced with the inevitable pester from friends and family: So when are you having kids? The older you are, the more pressing the question seems to be. Ticktock, ticktock.
Instead of hemming and hawing, you can just show them this chart instead. It shows how long people usually wait to have kids after getting married.
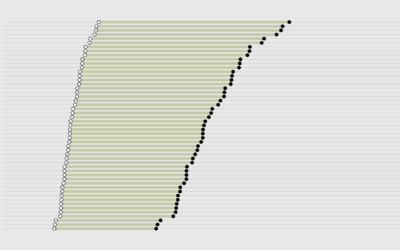
Age at Marriage vs. Time to Have a Kid
If they do have kids, married people usually have their first one during the first six years of marriage.
It’s based data from the 2015-2017 National Survey of Family Growth (NSFG), which is run by the Centers for Disease Control and Prevention (CDC). The circles are sized proportionally to estimated counts, but pay more attention to the overall distribution than on the individual points.
In the younger years, you see longer times in between marrying and having a kid, some nearly a decade. But once people get into their thirties, there’s less time to spare.
There are social reasons of course, but for women, it’s also biological, as shown below.
Pregnancy Outcome by Age of Mother
Getting pregnant can mean different things depending on where you are in life. Maybe pester newlyweds less.

AGE GROUP
15-19
20-24
25-29
30-34
35-39
40+
A higher percentage of pregnancies end in a miscarriage or stillbirth at older ages.
Miscarriage
Stillbirth
Ectopic
Abortion
Cesarian
Vaginal

AGE GROUP
15-19
20-24
25-29
30-34
35-39
40+
Miscarriage
A higher percentage of pregnancies end in a miscarriage or stillbirth at older ages.
Stillbirth
Ectopic
Abortion
Cesarian
Vaginal
In case you’re unfamiliar, the above is a mosaic plot, also known as a Marimekko diagram. The width of the columns represents the percentage of pregnancies for the age group. The height of each stacked rectangle represents the percentage of pregnancies that ended with corresponding outcome, in a given age group. The full range of both dimensions is 0% to 100%.
Chart Types Used


Become a member. Support an independent site. Get extra visualization goodness.
See What You Get