More Dual Income, No Kids
People are waiting longer to have kids or not having kids at all, which leads to more dual income households with no kids. This is the breakdown between 1980 to 2022, among married couple households.

SINGLE INCOME
DUAL INCOME
3 OR MORE INCOMES
DINKs grow more common.
1 earner, 0 kids
2 earners, 0 kids
3+ earners, 0 kids
2.4%
42%
4%
2.2%
40%
NO KIDS
2.0%
38%
3%
1.8%
36%
1.6%
34%
2%
1980
1990
2000
2010
2022
1980
1990
2000
2010
2022
1980
1990
2000
2010
2022
1 earner, 1 kid
2 earners, 1 kid
3+ earners, 1 kid
10%
12%
2.0%
9%
ONE KID
1.6%
11%
8%
1.2%
10%
1980
1990
2000
2010
2022
1980
1990
2000
2010
2022
1980
1990
2000
2010
2022
1 earner, 2 kids
2 earners, 2 kids
+3 earners, 2 kids
14%
8.0%
2.4%
7.5%
13%
TWO KIDS
2.0%
7.0%
12%
6.5%
1.6%
1980
1990
2000
2010
2022
1980
1990
2000
2010
2022
1980
1990
2000
2010
2022
1 earner, 3 kids
2 earners, 3 kids
3+ earners, 3 kids
1.4%
4.5%
5.0%
1.2%
4.0%
THREE KIDS
3.5%
4.6%
1.0%
3.0%
4.2%
0.8%
1980
1990
2000
2010
2022
1980
1990
2000
2010
2022
1980
1990
2000
2010
2022
1 earner, 4 kids
2 earners, 4 kids
3+ earners, 4 kids
1.4%
2.0%
0.5%
1.3%
1.5%
FOUR KIDS
0.4%
1.2%
1.0%
1.1%
0.3%
1980
1990
2000
2010
2022
1980
1990
2000
2010
2022
1980
1990
2000
2010
2022
1 earner, 5+ kids
2 earners, 5+ kids
3+ earners, 5+ kids
1.4%
0.25%
1.2%
0.5%
FIVE OR
MORE KIDS
1.0%
0.20%
0.8%
0.4%
0.6%
0.15%
0.4%
1980
1990
2000
2010
2022
1980
1990
2000
2010
2022
1980
1990
2000
2010
2022
SOURCE: CURRENT POPULATION SURVEY / BY: FLOWINGDATA

SINGLE INCOME
DUAL INCOME
3+ INCOMES
DINKs grow more common.
1 earner, 0 kids
2 earners, 0 kids
3+ earners, 0 kids
2.4%
42%
4%
2.0%
38%
3%
1.6%
34%
2%
1980
2022
1980
2022
1980
2022
1 earner, 1 kid
2 earners, 1 kid
3+ earners, 1 kid
10%
12%
2.0%
9%
1.6%
11%
8%
1.2%
10%
1980
2022
1980
2022
1980
2022
1 earner, 2 kids
2 earners, 2 kids
+3 earners, 2 kids
14%
8.0%
2.4%
7.5%
13%
2.0%
7.0%
12%
6.5%
1.6%
1980
2022
1980
2022
1980
2022
1 earner, 3 kids
2 earners, 3 kids
3+ earners, 3 kids
1.4%
4.5%
5.0%
1.2%
4.0%
3.5%
4.6%
1.0%
3.0%
4.2%
0.8%
1980
2022
1980
2022
1980
2022
1 earner, 4 kids
2 earners, 4 kids
3+ earners, 4 kids
1.4%
2.0%
0.5%
1.3%
1.5%
0.4%
1.2%
1.0%
1.1%
0.3%
1980
2022
1980
2022
1980
2022
1 earner, 5+ kids
2 earners, 5+ kids
3+ earners, 5+ kids
.25%
1.2%
0.5%
.20%
0.8%
0.4%
.15%
0.4%
1980
2022
1980
2022
1980
2022
SOURCE: CURRENT POPULATION SURVEY / BY: FLOWINGDATA
I expected the patterns to be a little less one-sided, but dual income, no kids is clearly the most common and seems to be headed towards half of households with married couples.
Obvious next question: what about single people with and without kids?
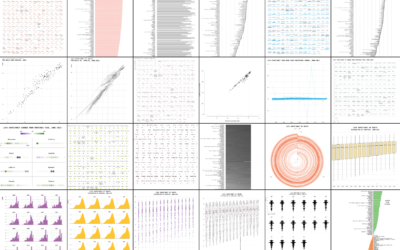
Chart Types Used


Become a member. Support an independent site. Get extra visualization goodness.
See What You Get