How We Spent Our Time in 2020 Versus 2019
Our everyday routines changed over the past year, and with the recent data release from the 2020 American Time Use Survey, we can see by how much.
The survey, published by the Bureau of Labor Statistics, asks participants what they did over a 24-hour period. Usually, the survey is ongoing with results published each year, but in 2020, it was suspended from mid-March to mid-May.
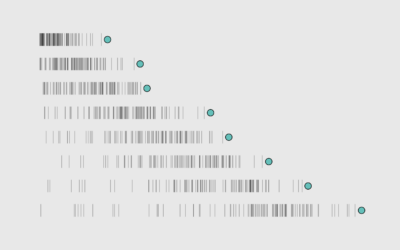
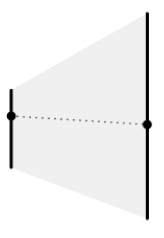
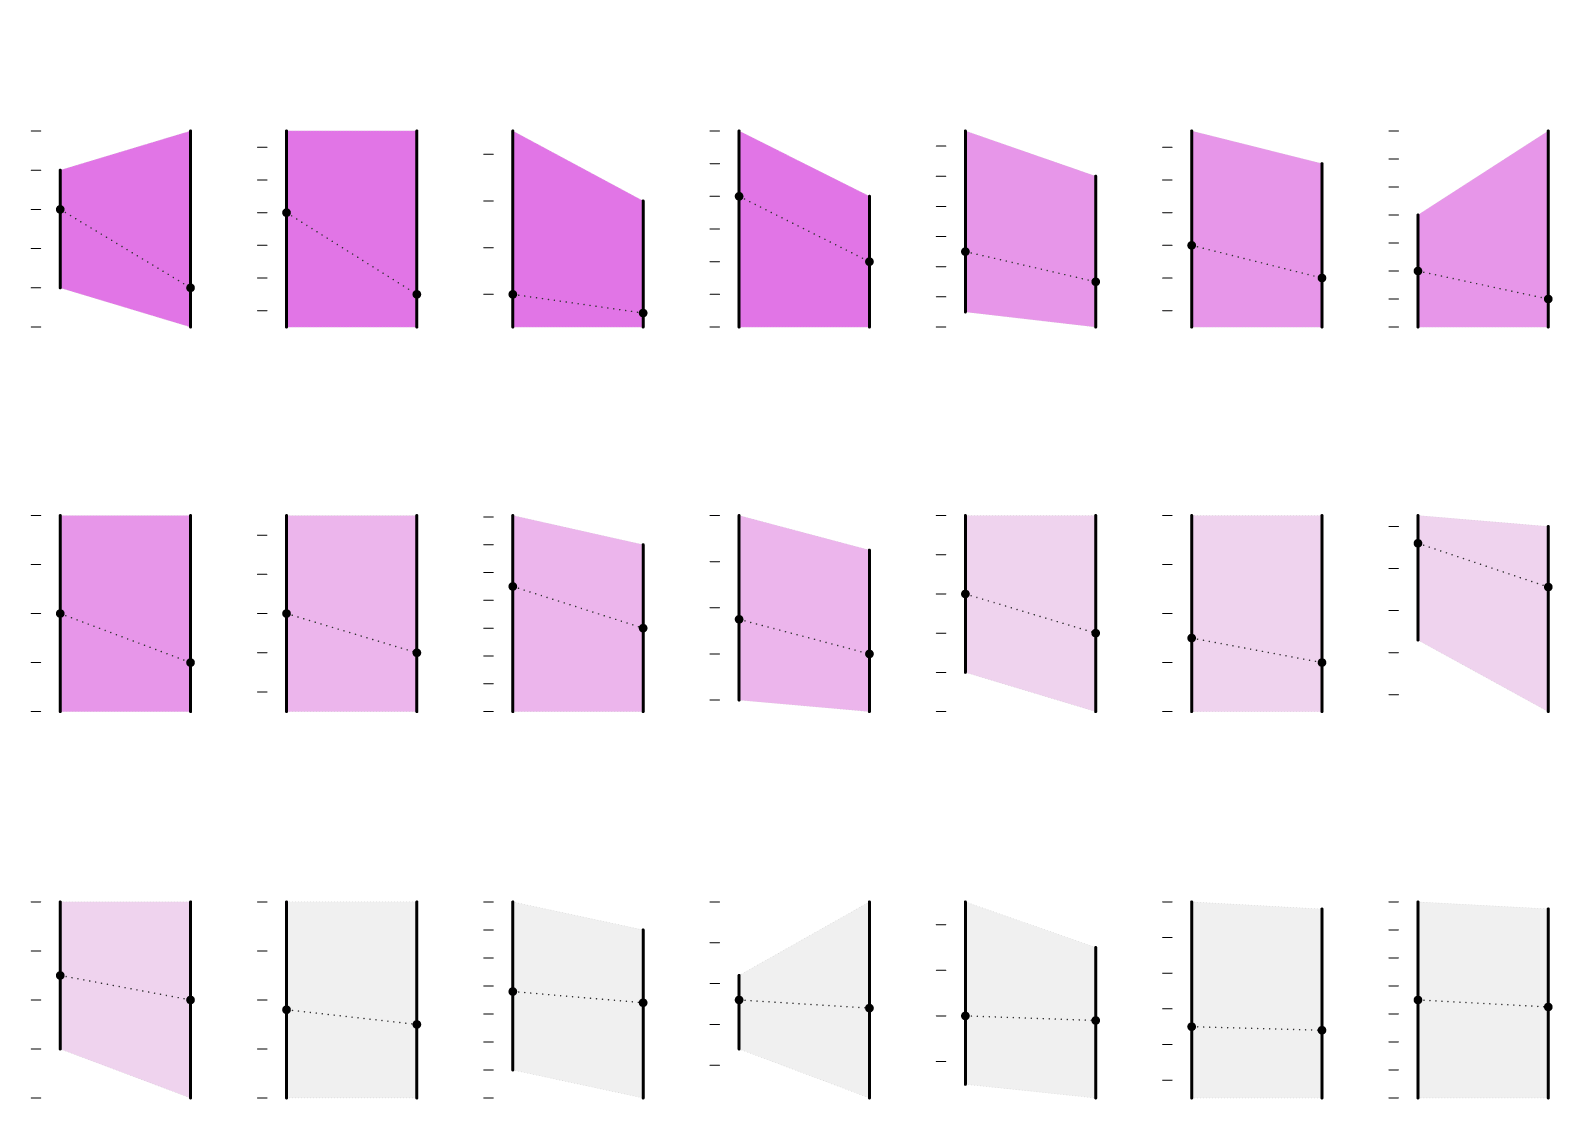
Still, we can see the shifts in activities. The charts below show how people spent their time in 2019 and 2020. Here’s how to read them:
2019
2020
20
75th
percentile
15
MINUTES
IN DAY
10
Median
5
25th
percentile
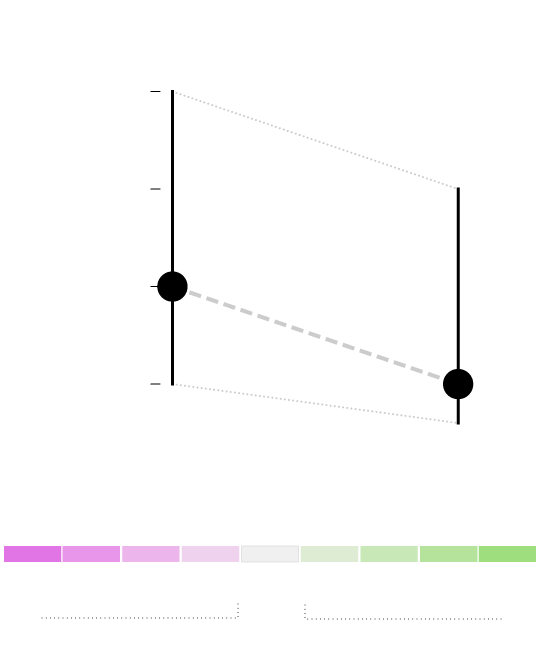
MEDIAN CHANGE FROM 2019 TO 2020
-40%
-30%
-20%
-10%
+10%
+20%
+30%
+40%
Less time
More time
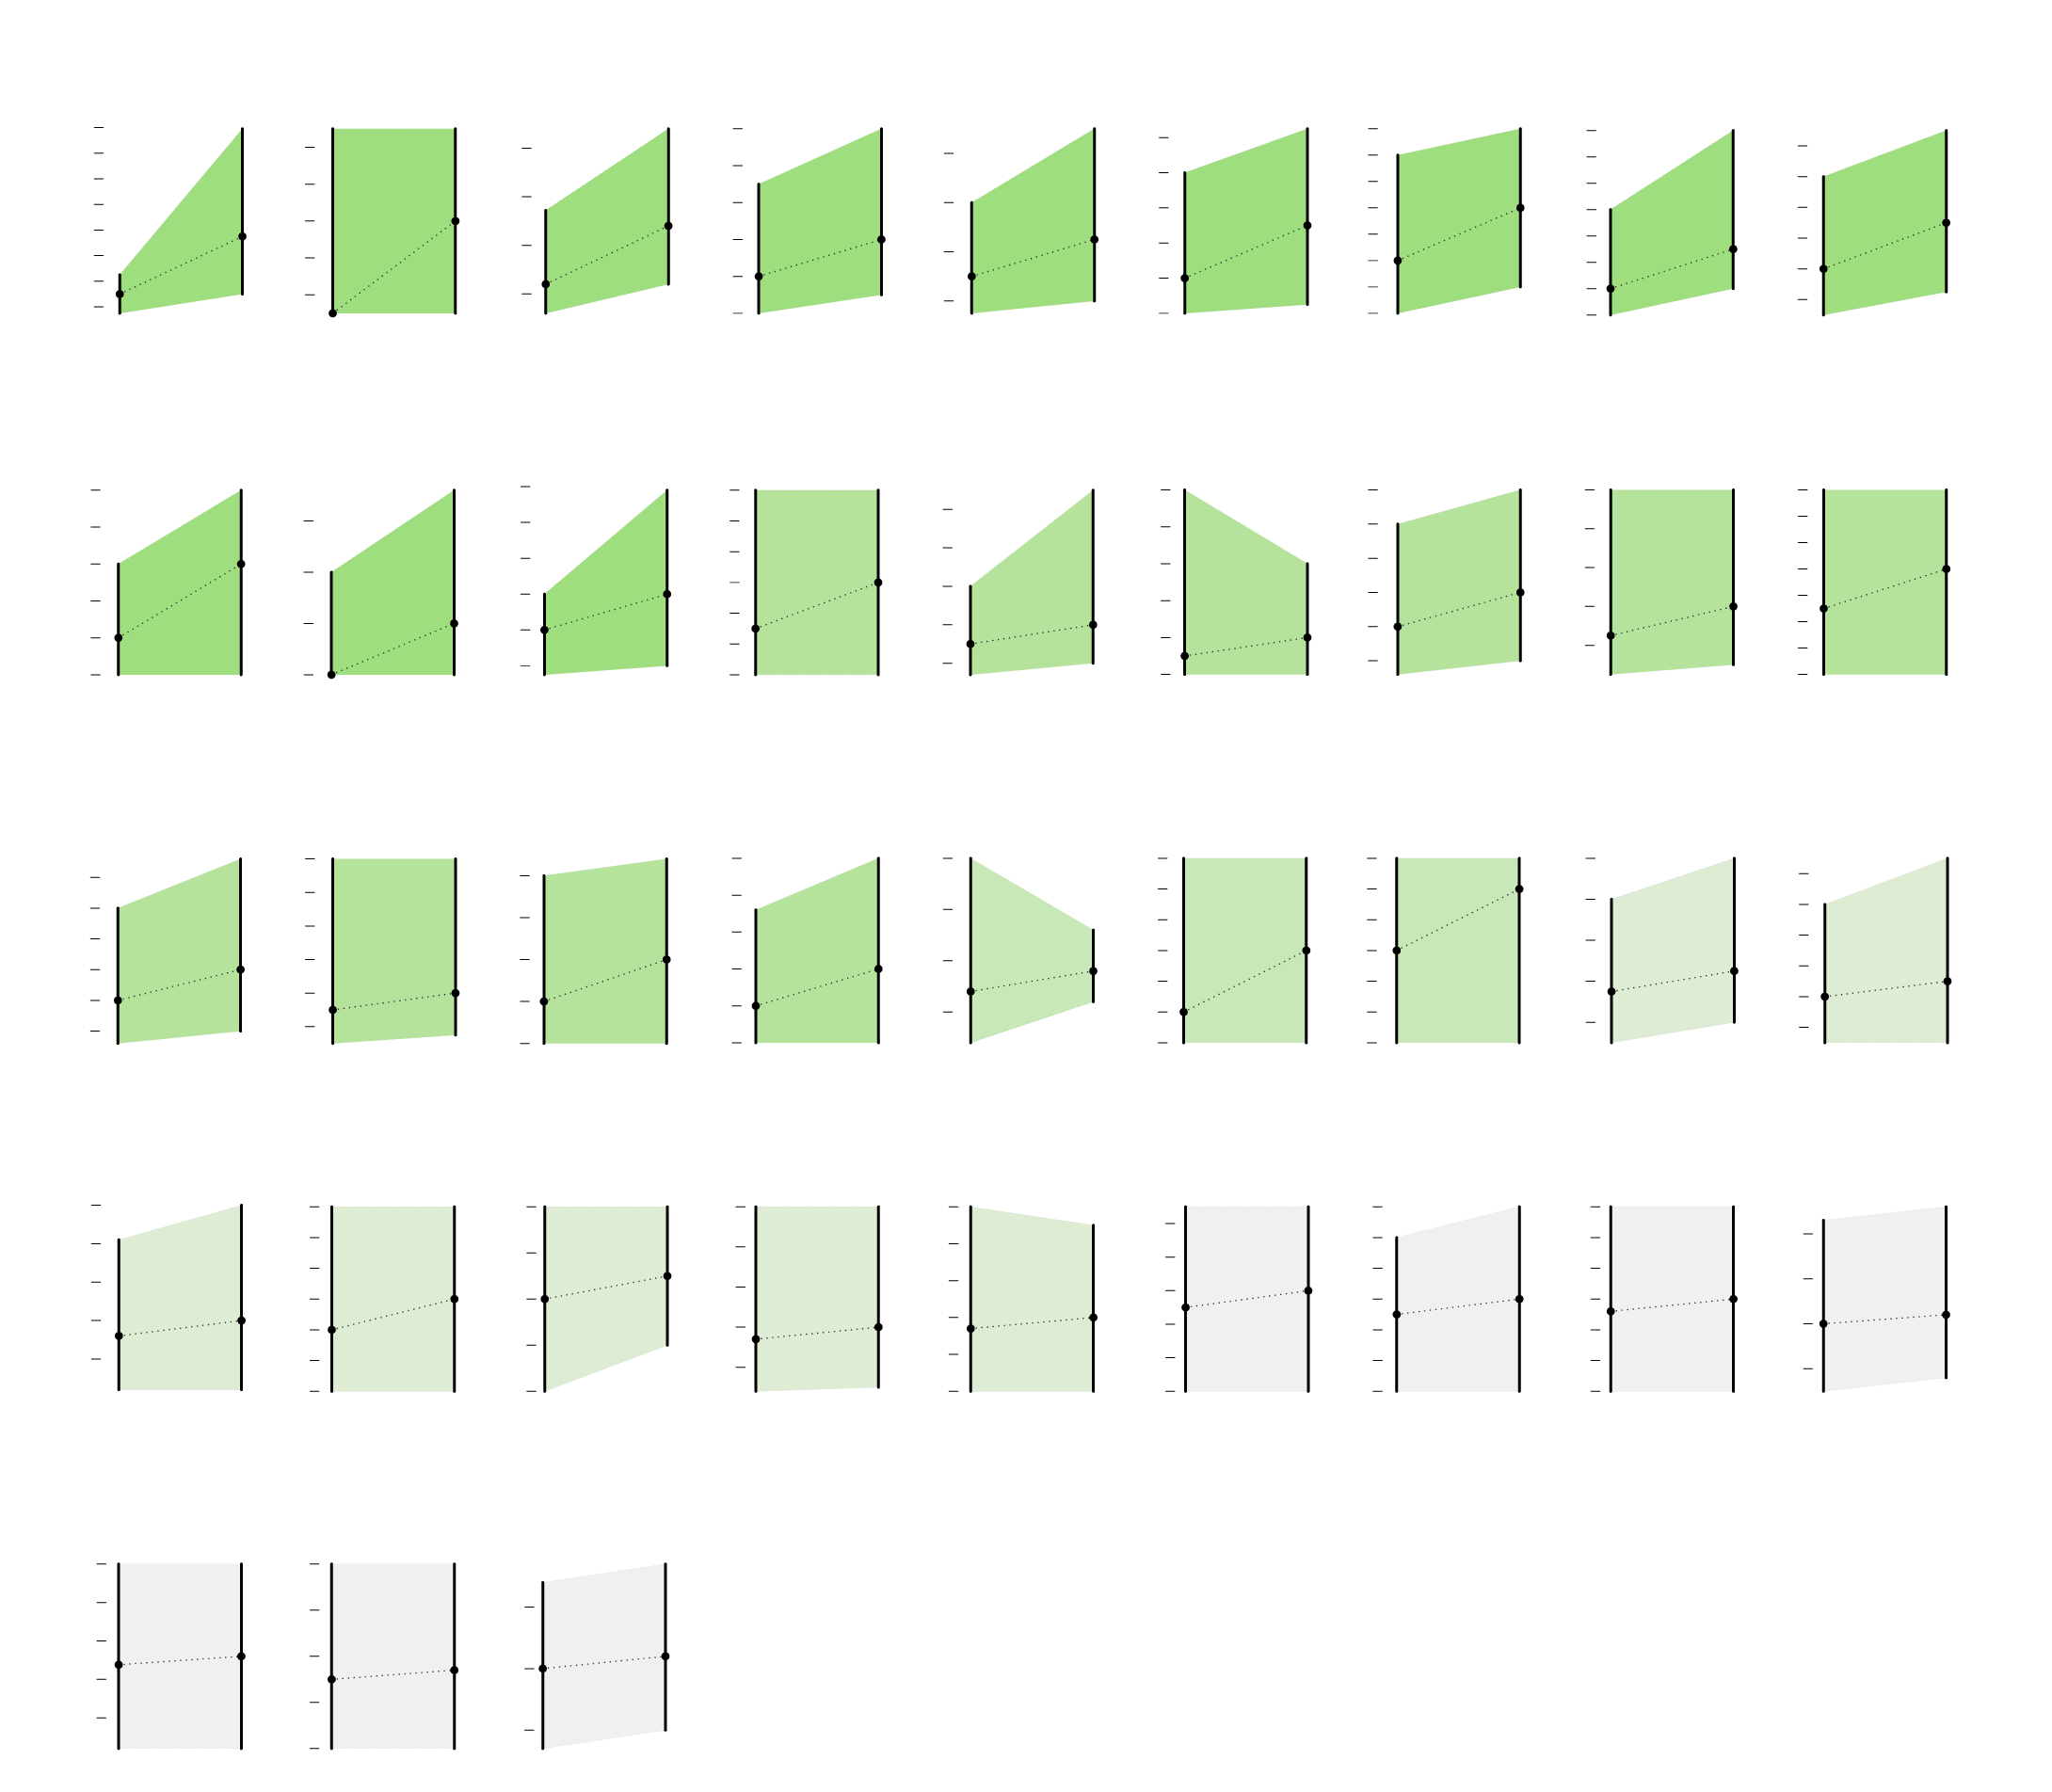
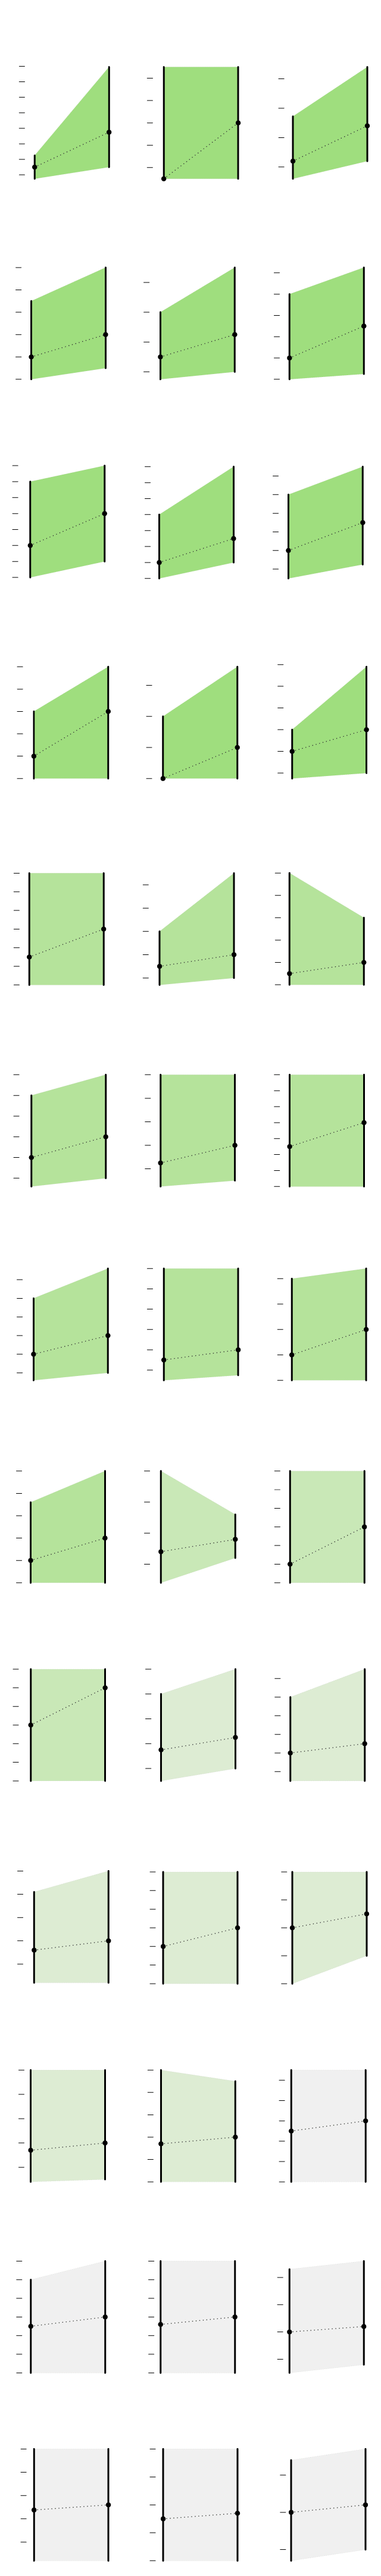
First, we look at the activities where people spent more time. More green means more time compared to 2019. “Listening to the radio” leads the way with the median more than doubling and the 75th percentile almost quadrupling. Also, to no one’s surprise, people spent more time on home projects.
Listening to
the radio
Home security
Interior arrange.,
decoration, and
repairs
Computer use for
leisure (not
games)
Financial
management
Playing with
hh children,
not sports
Personal e−mail
and messages
Homework with
household
children
Lawn, garden,
and houseplant
care
2019
2020
2019
2020
2019
2020
2019
2020
2019
2020
2019
2020
2019
2020
2019
2020
2019
2020
160
120
45
90
140
140
14
200
140
80
40
80
100
120
120
120
35
70
12
150
80
60
100
100
100
30
60
10
80
25
50
80
60
80
100
40
60
8
20
40
60
40
60
40
15
30
50
6
40
20
20
20
40
10
20
Reading to/with
household
children
Storing interior
household items,
including food
Phone calls to/
from friends,
neighbors
Playing games
Traveling to/
from gas station
Household/
personal
organization
Travel related to
eating and
drinking
Exterior
cleaning
Laundry
2019
2020
2019
2020
2019
2020
2019
2020
2019
2020
2019
2020
2019
2020
2019
2020
2019
2020
120
60
35
120
90
40
180
50
80
25
160
100
30
50
35
100
70
40
140
25
80
40
30
80
60
20
120
30
20
60
50
30
25
60
100
40
15
20
15
40
20
20
80
40
30
10
10
20
10
20
15
10
60
Travel for
household
management
App, tool, toy
set−up, repair,
maint. (by self)
Waiting for/with
hh children
Waiting assoc.
with helping
household adults
Arts and crafts
as a hobby
Running
Weightlifting/
strength training
Gap/can’t
remember
Telephone calls,
miscellaneous
2019
2020
2019
2020
2019
2020
2019
2020
2019
2020
2019
2020
2019
2020
2019
2020
2019
2020
35
200
60
60
120
120
70
30
35
55
55
100
30
100
60
30
150
25
50
50
80
25
50
25
80
45
45
60
20
100
40
20
20
40
40
60
40
30
15
15
15
50
35
35
40
20
20
10
10
30
30
10
Walking
Biking
Relaxing,
thinking
Looking after
hh children (as
prim. activity)
Eating and
drinking
Sleeplessness
Travel related
to taking class
Television and
movies (not
religious)
Rsrch/HW for
class for degree
or license
2019
2020
2019
2020
2019
2020
2019
2020
2019
2020
2019
2020
2019
2020
2019
2020
2019
2020
300
60
60
120
60
90
45
80
250
55
80
40
250
50
100
50
70
50
70
35
200
40
200
80
60
45
40
60
30
30
150
150
50
60
40
50
25
30
20
40
100
35
40
20
40
100
30
20
10
30
30
15
Work,
other job(s)
Food and drink
preparation
Sleeping
2019
2020
2019
2020
2019
2020
300
60
250
550
50
200
40
500
150
30
100
450
20
Interior arrange.,
decoration, and
repairs
Listening to
the radio
Home security
2019
2020
2019
2020
2019
2020
160
14
200
140
120
12
150
100
10
80
100
60
8
40
50
6
20
Computer use for
leisure (not
games)
Financial
management
Playing with
household children,
not sports
2019
2020
2019
2020
2019
2020
120
140
80
100
120
80
60
100
60
80
40
40
60
20
20
40
Personal e−mail
and messages
Homework with
household
children
Lawn, garden, and
houseplant care
2019
2020
2019
2020
2019
2020
45
90
140
40
80
120
35
70
100
30
60
25
50
80
20
40
60
15
30
40
10
20
Reading to/with
household
children
Storing interior
household items,
including food
Phone calls to/
from friends,
neighbors
2019
2020
2019
2020
2019
2020
120
40
25
100
35
80
30
20
60
25
15
40
20
20
15
10
Playing games
Traveling to/from
gas station
Household/personal
organization
2019
2020
2019
2020
2019
2020
60
180
50
160
50
40
140
40
120
30
30
100
20
20
80
10
10
60
Travel for
eating and
drinking
Exterior
cleaning
Laundry
2019
2020
2019
2020
2019
2020
35
120
90
80
30
100
70
25
80
60
20
50
60
40
15
40
30
10
20
Travel for
household
management
App, tool, toy
set−up, repair,
maint. (by self)
Waiting for/with
hh children
2019
2020
2019
2020
2019
2020
120
30
35
100
30
25
80
25
60
20
20
40
15
15
20
10
10
Waiting assoc.
with helping
household adults
Arts and crafts
as a hobby
Running
2019
2020
2019
2020
2019
2020
35
200
60
55
30
150
50
25
45
100
20
40
15
50
35
10
30
Weightlifting/
strength training
Gap/
can’t remember
Telephone calls,
miscellaneous
2019
2020
2019
2020
2019
2020
60
120
70
55
100
60
50
50
80
45
40
40
60
30
35
40
20
30
Rsrch/HW for
class for degree
or license
Walking
Biking
2019
2020
2019
2020
2019
2020
300
60
60
55
250
50
50
200
45
40
150
40
30
100
35
30
20
Relaxing, thinking
Looking after
hh children (as
a prim. activity)
Eating and
drinking
2019
2020
2019
2020
2019
2020
120
60
80
50
100
70
40
80
60
30
50
60
20
40
40
10
30
Sleeplessness
Travel related
to taking class
Television
and movies
(not religious)
2019
2020
2019
2020
2019
2020
90
45
250
80
40
70
35
200
60
30
150
50
25
40
20
100
30
15
Work, other
job(s)
Food and drink
preparation
Sleeping
2019
2020
2019
2020
2019
2020
300
60
250
550
50
200
40
500
150
30
100
450
20
By looking at ranges from the 25th to 75th percentiles, we can see not just how the middle (median) changed, but also the variation within some activities.
For example, the median duration for household organization went up while the upper limit went down. The shape is more trapezoid than parallelogram. This seems to suggest people spent more time overall, but those who spent the most time on household organization pre-pandemic spent their time elsewhere.
Similarly, activities with children show a more significant increase on the upper end, but those without children in the household keep the bottom end more flat.
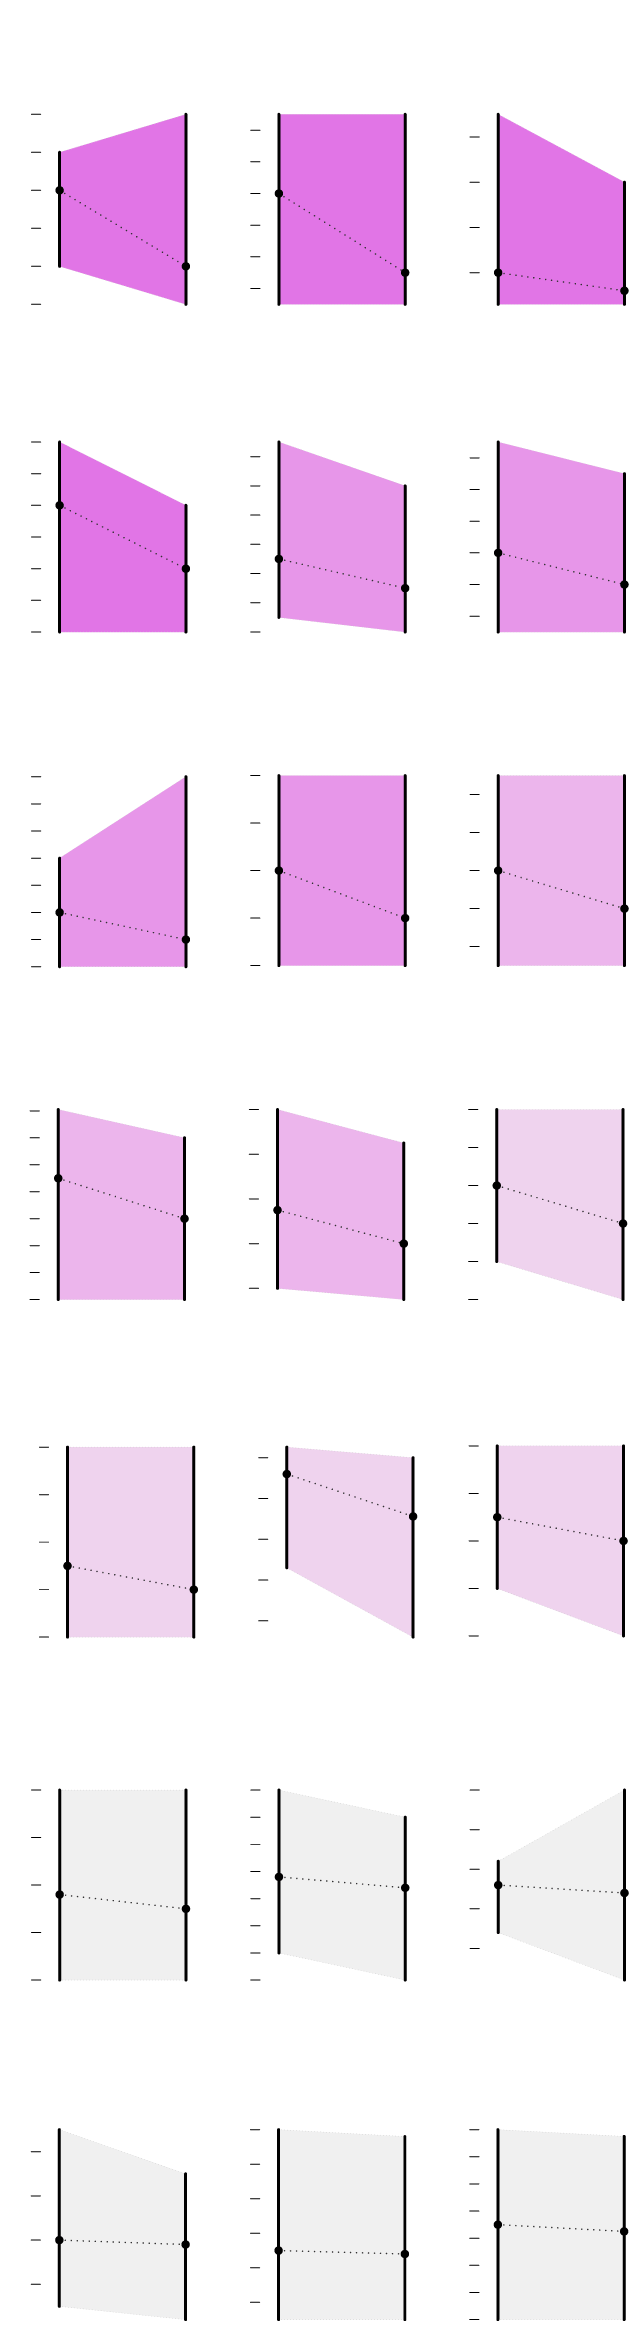
So where do the minutes come from? Here are activities that decreased the most, relatively speaking. More purple means steeper decrease.
Shopping, except
groceries, food,
and gas
Waiting assoc.
w/ helping nonhh
adults
Dropping off/
picking up
nonhh children
Health−related
self care
Travel for
religious/
spiritual prac.
Picking up/
dropping off
nonhh adult
Travel for
personal care
2019
2020
2019
2020
2019
2020
2019
2020
2019
2020
2019
2020
2019
2020
30
40
45
14
14
70
40
40
35
25
12
12
60
35
30
30
10
20
10
50
30
25
8
25
8
40
20
15
20
6
20
6
30
10
10
15
4
15
4
20
5
10
2
10
Travel for
relaxing and
leisure
Sewing, repairing,
and maintaining
textiles
Travel to
help household
adults
Banking
Using personal
care services
Walking,
playing
with animals
Taking class for
degree, certif.,
or license
2019
2020
2019
2020
2019
2020
2019
2020
2019
2020
2019
2020
2019
2020
30
120
40
60
200
400
14
180
35
100
25
50
350
160
12
30
140
80
300
20
10
40
120
25
250
8
60
100
15
30
20
80
6
200
40
10
60
15
20
Working out
Travel related
to working
Travel to care
for and help
nonHH kids
Home schooling
of household
children
Travel to help
nonhh adults
Physical care
for household
children
Work, main job
2019
2020
2019
2020
2019
2020
2019
2020
2019
2020
2019
2020
2019
2020
60
60
45
300
80
560
50
40
540
70
250
50
50
35
520
40
60
200
30
500
40
40
50
25
480
30
150
20
460
40
30
30
20
100
15
440
30
20
20
10
420
Waiting assoc.
w/ helping nonhh
adults
Dropping off/
picking up
nonhh children
Health−related
self care
2019
2020
2019
2020
2019
2020
30
14
40
25
12
30
20
10
8
20
15
6
10
10
4
5
Travel for
religious
practices
Picking up/
dropping off
nonhh adult
Shopping, except
groceries, food,
and gas
2019
2020
2019
2020
2019
2020
40
14
70
35
12
60
30
10
50
25
8
40
20
6
30
15
4
20
10
2
Travel for
relaxing and
leisure
Banking
Travel for
personal care
2019
2020
2019
2020
2019
2020
30
45
14
40
25
35
12
30
20
10
25
8
20
15
15
6
10
10
Sewing and
repairing,
textiles
Travel to
help hh adults
Using personal
care services
2019
2020
2019
2020
2019
2020
120
40
200
180
35
100
160
30
140
80
120
25
60
100
20
80
40
60
15
Working out
Walking, playing
with animals
Taking class for
degree, certif.,
or license
2019
2020
2019
2020
2019
2020
60
60
400
50
50
350
300
40
40
250
30
30
200
20
20
Travel related
to working
Travel related to
caring for and
helping nonHH kids
Home schooling
of hh children
2019
2020
2019
2020
2019
2020
60
45
300
40
250
50
35
200
30
40
25
150
20
30
100
15
20
10
Physical care
for household
children
Travel related to
helping nonhh
adults
Work, main job
2019
2020
2019
2020
2019
2020
80
560
50
540
70
520
40
60
500
50
480
30
460
40
20
440
30
420
Time spent waiting and dropping off others was down about half, probably because no one went anywhere, as supported by travel and commute times also down.
Health-related self care, personal care services, and working out jump out at me as activities that went down in time that I bet people miss.
The shape for home schooling of household children has me curious. I thought time would have increased across the board, but people seemed split in 2020.
I’m also curious about splits across demographic groups. Low income versus high income? Essential workers versus non-essential? Kids versus no kids? There’s a lot to look at.
Notes
- The data comes from the American Time Use Survey, which is published the Bureau of Labor Statistics. You can download the data from BLS, or you can get a specified subset of the microdata via IPUMS, which is what I did.
- I calculated the percentiles based on those who recorded the activity. It would be an interesting next step to look at the percentage of people who recorded the activity.
- I made the charts with R and Adobe Illustrator.
Chart Types Used


Become a member. Support an independent site. Make great charts.
See What You Get