Redefining Old Age
What is old? If you ask my son, he’d probably give a non-numeric answer. “Anyone with white hair and glasses.” By his definition, I’ve been old since age 30.
If you ask the World Health Organization, they might say it depends on where you live, because people who live in more developed countries tend to live longer.
In 1965, Bernice Neugarten, a psychologist who researched aging, conducted a survey that asked people what old meant. Respondents said an old man was 65 to 75 years old, and an old woman was 60 to 75 years old. That they said women became “old” faster even though women tend to live longer is certainly a sign of the time.
By most dictionary-ish definitions, old age is what happens after middle age (with similarly fuzzy ranges), which is around 65.
Looking through the various definitions, 65 does seem to be the recurring number for the start of old age. But as we’ve seen, people continue to live longer on average. If we keep the same definition of “old”, then people are just going to be old for a longer part of their lives.
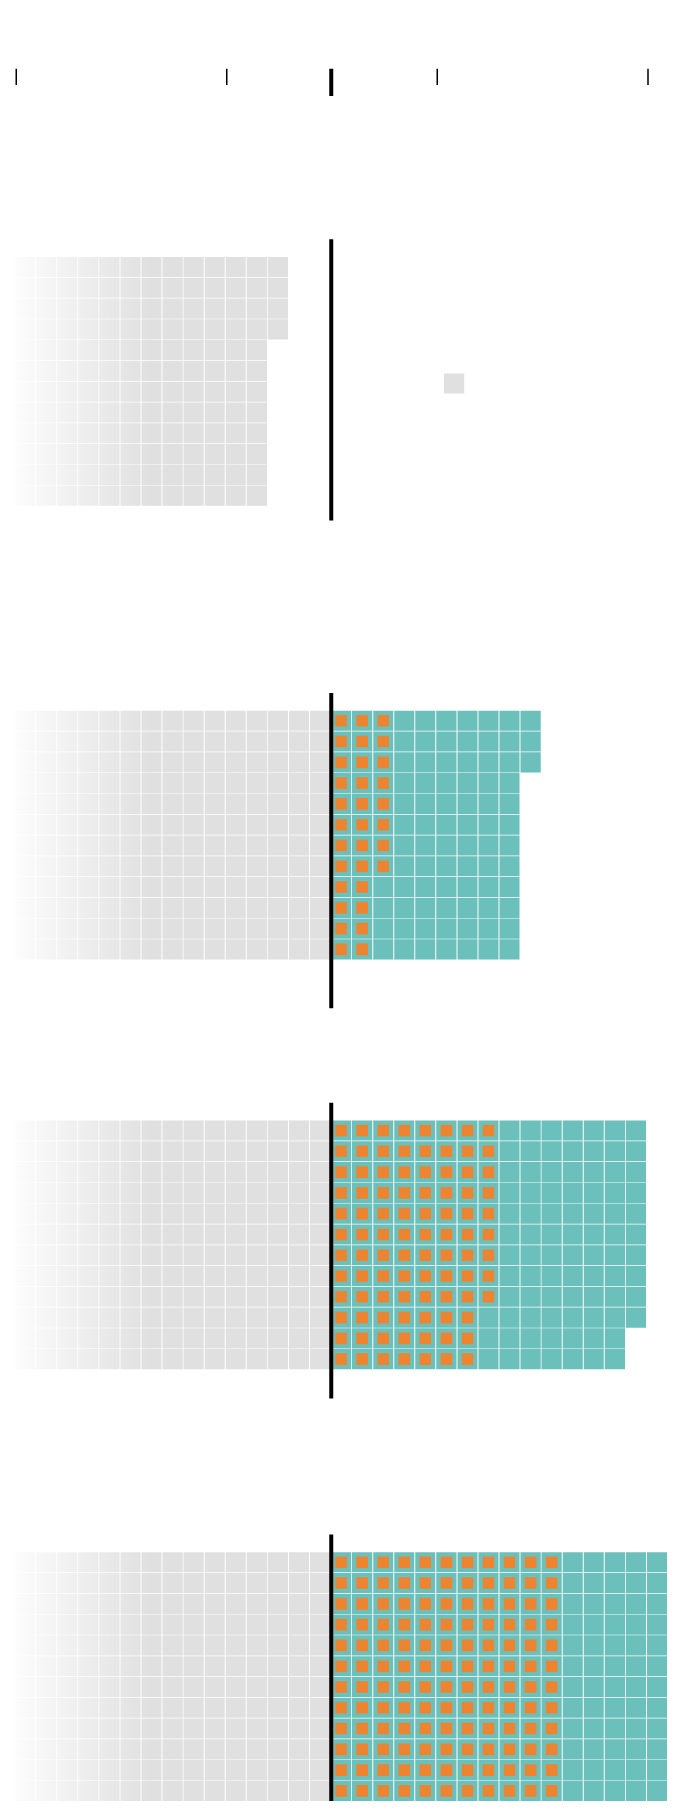
Old Age at the Same Time
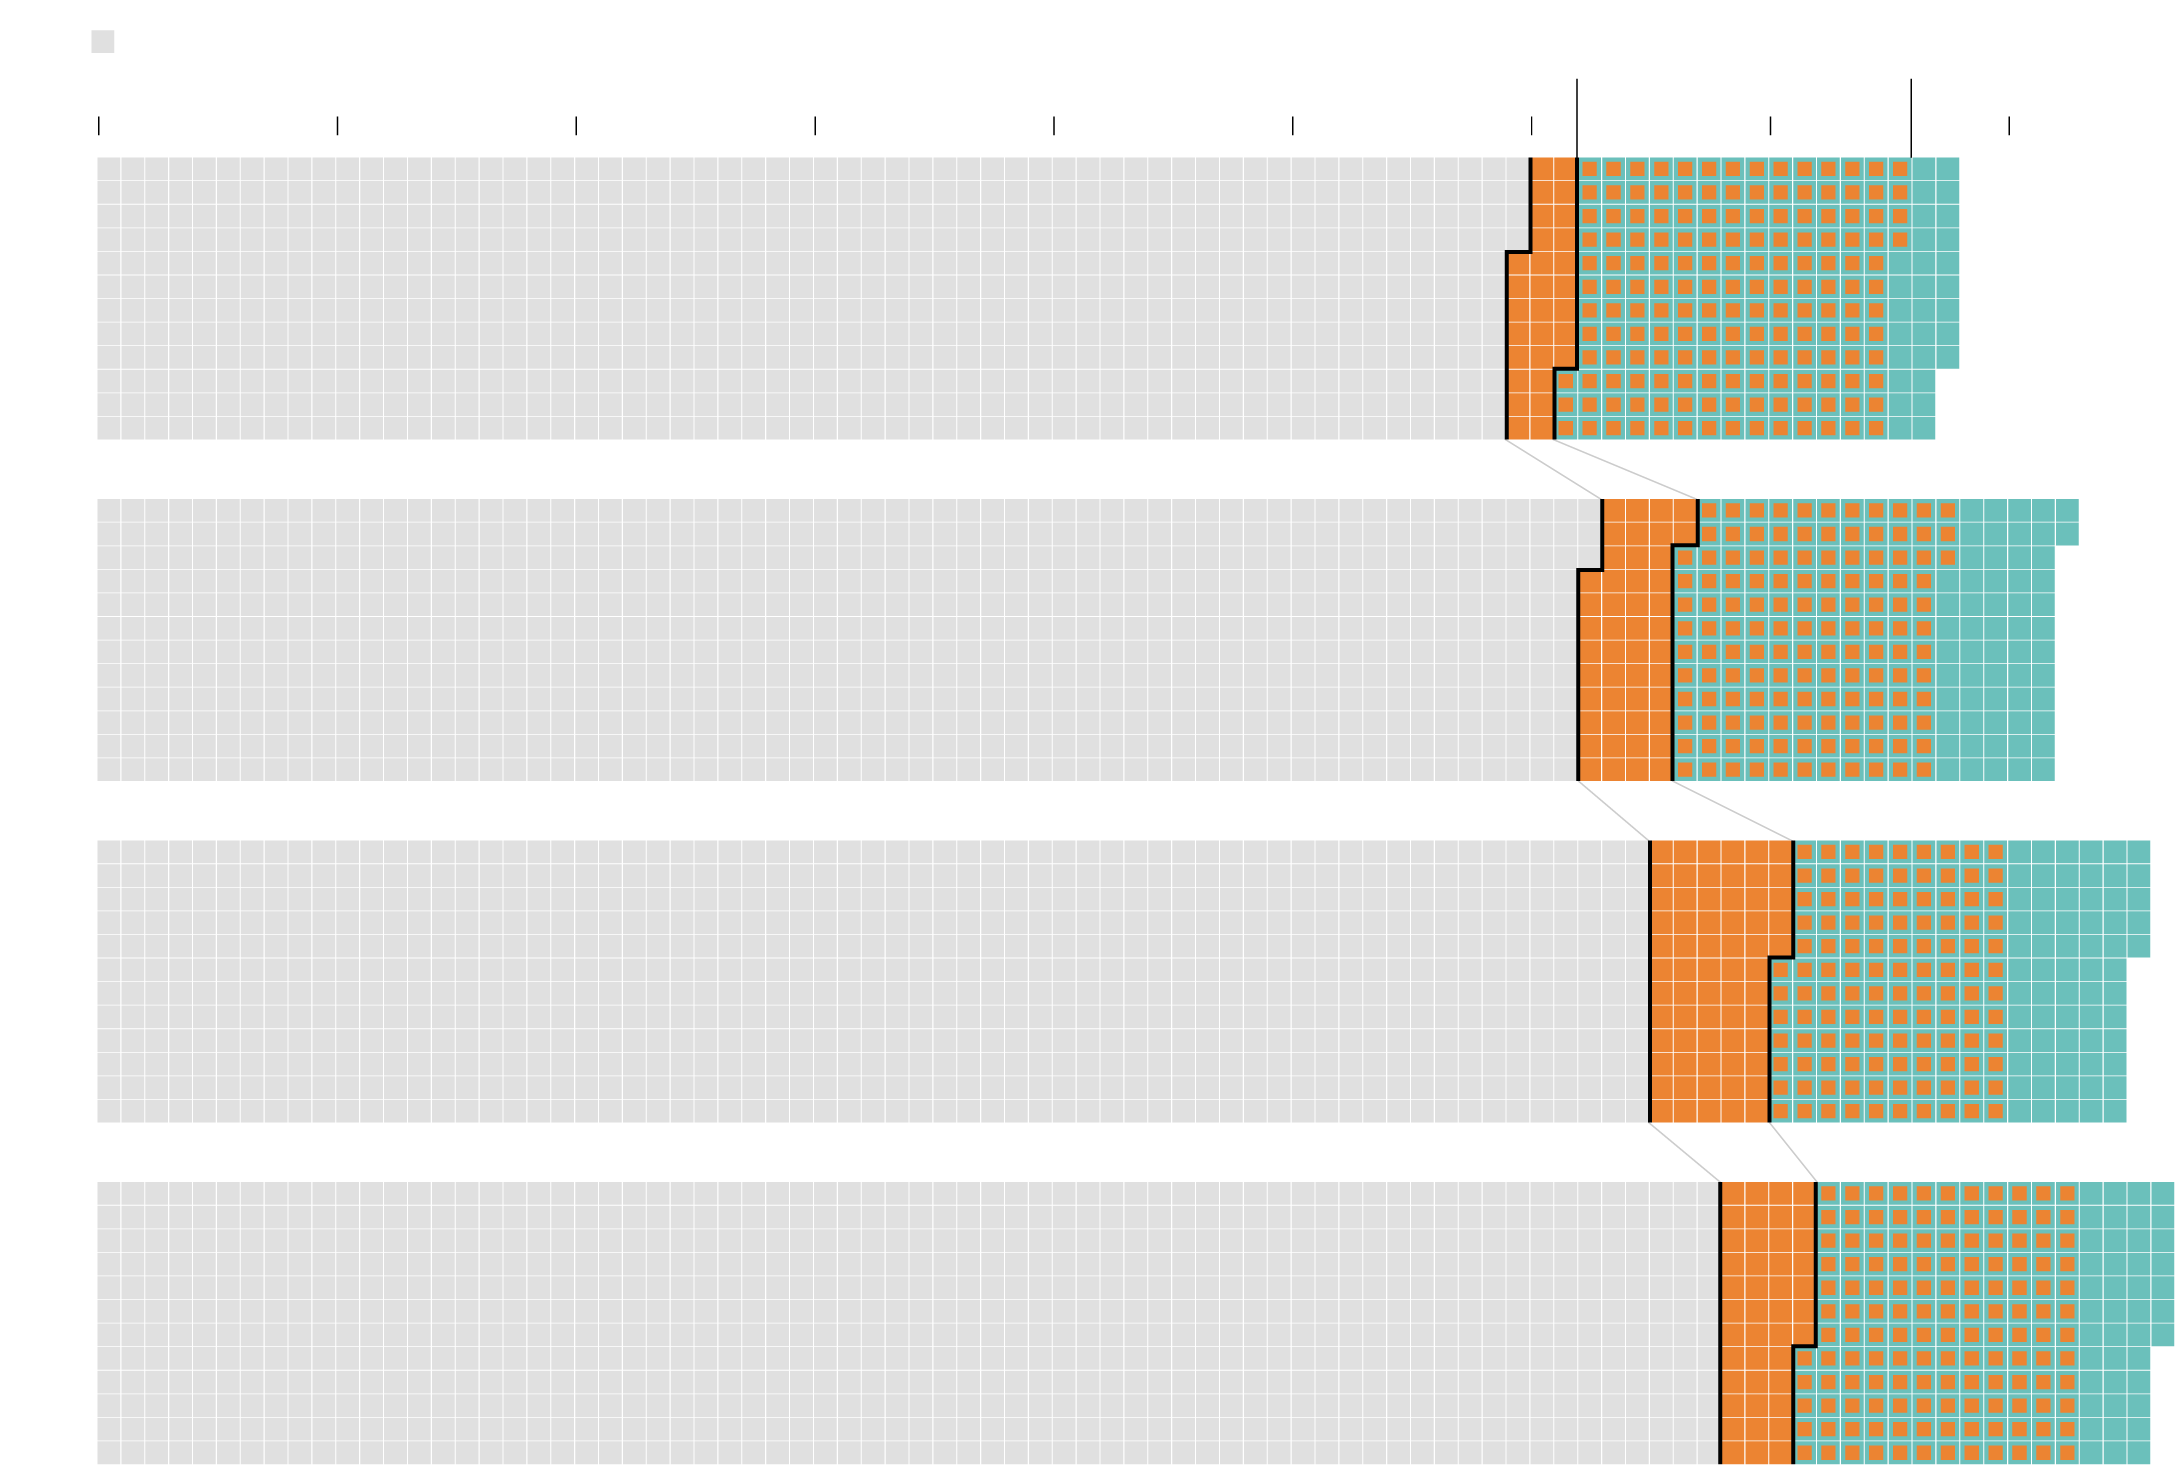
Keep the definition of old age static, and people are “old” for longer.

= 1 MONTH
OLD AGE, FIXED
0 YEARS OLD
10
20
30
40
50
60
65
70
80
In 1930, only about 50% of males and 57% of females made it to the “old age” of 65. The key to staying young forever is to die earlier.
1930
MALE LIFE EXPECTANCY
FEMALE LIFE EXPECTANCY
As life expectancy increases, it grows more common to spend more years in old age. In 1960, the life expectancy for males was 66 years and 8 months. The life expectancy for females, who tend to live longer, was 73 years and 3 months.
With a fixed limit, females are “old” for longer.
1960
Because the old age threshold is fixed, a larger percentage of one’s life is spent being old.
1990
On average, males spend 11 years in old age and females spend 16 years, or 14% and 20% of their lives, respectively.
2020
OLD AGE, FIXED
50 years old
60
65
70
80
In 1930, only about 50% of males and 57% of females made it to the “old age” of 65. The key to staying young forever is to die earlier.
1930
= 1 MONTH
As life expectancy increases, it grows more common to spend more years in old age. In 1960, the life expectancy for males was 66 years and 8 months and 73 years and 3 months for females.
1960
Because the old age threshold is fixed, a larger percentage of one’s life is spent being old.
1990
On average, males spend 11 years in old age and females spend 16 years, or 14% and 20% of their lives, respectively.
2020
It appears that the definition of old needs to change with life expectancy, especially when you go back in time. In 1930, it was common for people to die before they even got to the old threshold, according to estimates from the Social Security Administration.
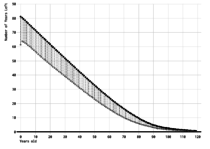
Here’s another way to look at it. Imagine a cohort of 100,000 people born during a year. The chart below shows how many are still alive up to a given age. The lines dip much sooner for 1930 than they do now.
You can also look at it by the average number of years left in one’s life, given your age, as shown below. At all ages, you’re expected to live longer now than you were in 1930 (surprise).
Warren Sanderson and Sergei Scherbov suggest that we classify old age by looking closer at the end. Instead of counting the number of years someone has lived (and whether or not they’re at least 65), we can go the other direction and look at the number of expected years left. They recommend the 15-year mark, as shown below.
Old Age Based on Years Left to Live
Now it changes depending on life expectancy. When people live longer, old age comes later instead of at a fixed age limit.
START OF OLD AGE FOR FEMALES
MALE LIFE EXPECTANCY
= 1 MONTH
0 YEARS OLD
10
20
30
40
50
60
70
80
FEMALE LIFE EXPECTANCY
There are also old age years now when we count by years remaining instead of using a fixed threshold.
1930
START OF OLD AGE FOR MALES
As life expectancy increases, the average number of years in old age stays the same.
1960
In other words, people are “old” for the same number of years on average and can be considered young and middle age for much longer.
1990
This provides guidance for saving income for the future and retirement, and likely shifts one’s age identity.
2020

= 1 MONTH
50 years old
60
70
80
There are also old age years now when we count by years remaining instead of using a fixed threshold.
START OF OLD AGE FOR FEMALES
MALE LIFE EXPECTANCY
START OF OLD AGE FOR MALES
FEMALE LIFE EXPECTANCY
1930
As life expectancy increases, the average number of years in old age stays the same.
1960
In other words, people are “old” for the same number of years on average and can be considered young and middle age for much longer.
1990
This provides guidance for saving income for the future and retirement, and likely shifts one’s age identity.
2020
This makes more sense than classifying those who are 65 and above as “old”. The marker moves with life expectancy.
Obviously there’s still a lot of variation between people who are the same age. Some people who are 65 might look 40, and vice versa. But if we’re going to put a concrete marker on it, hooking it in with life expectancy seems to be the way to go.
At the very least, it’s a lot better than my son’s white-hair-and-glasses classification scheme.
Chart Types Used


Become a member. Support an independent site. Make great charts.
See What You Get