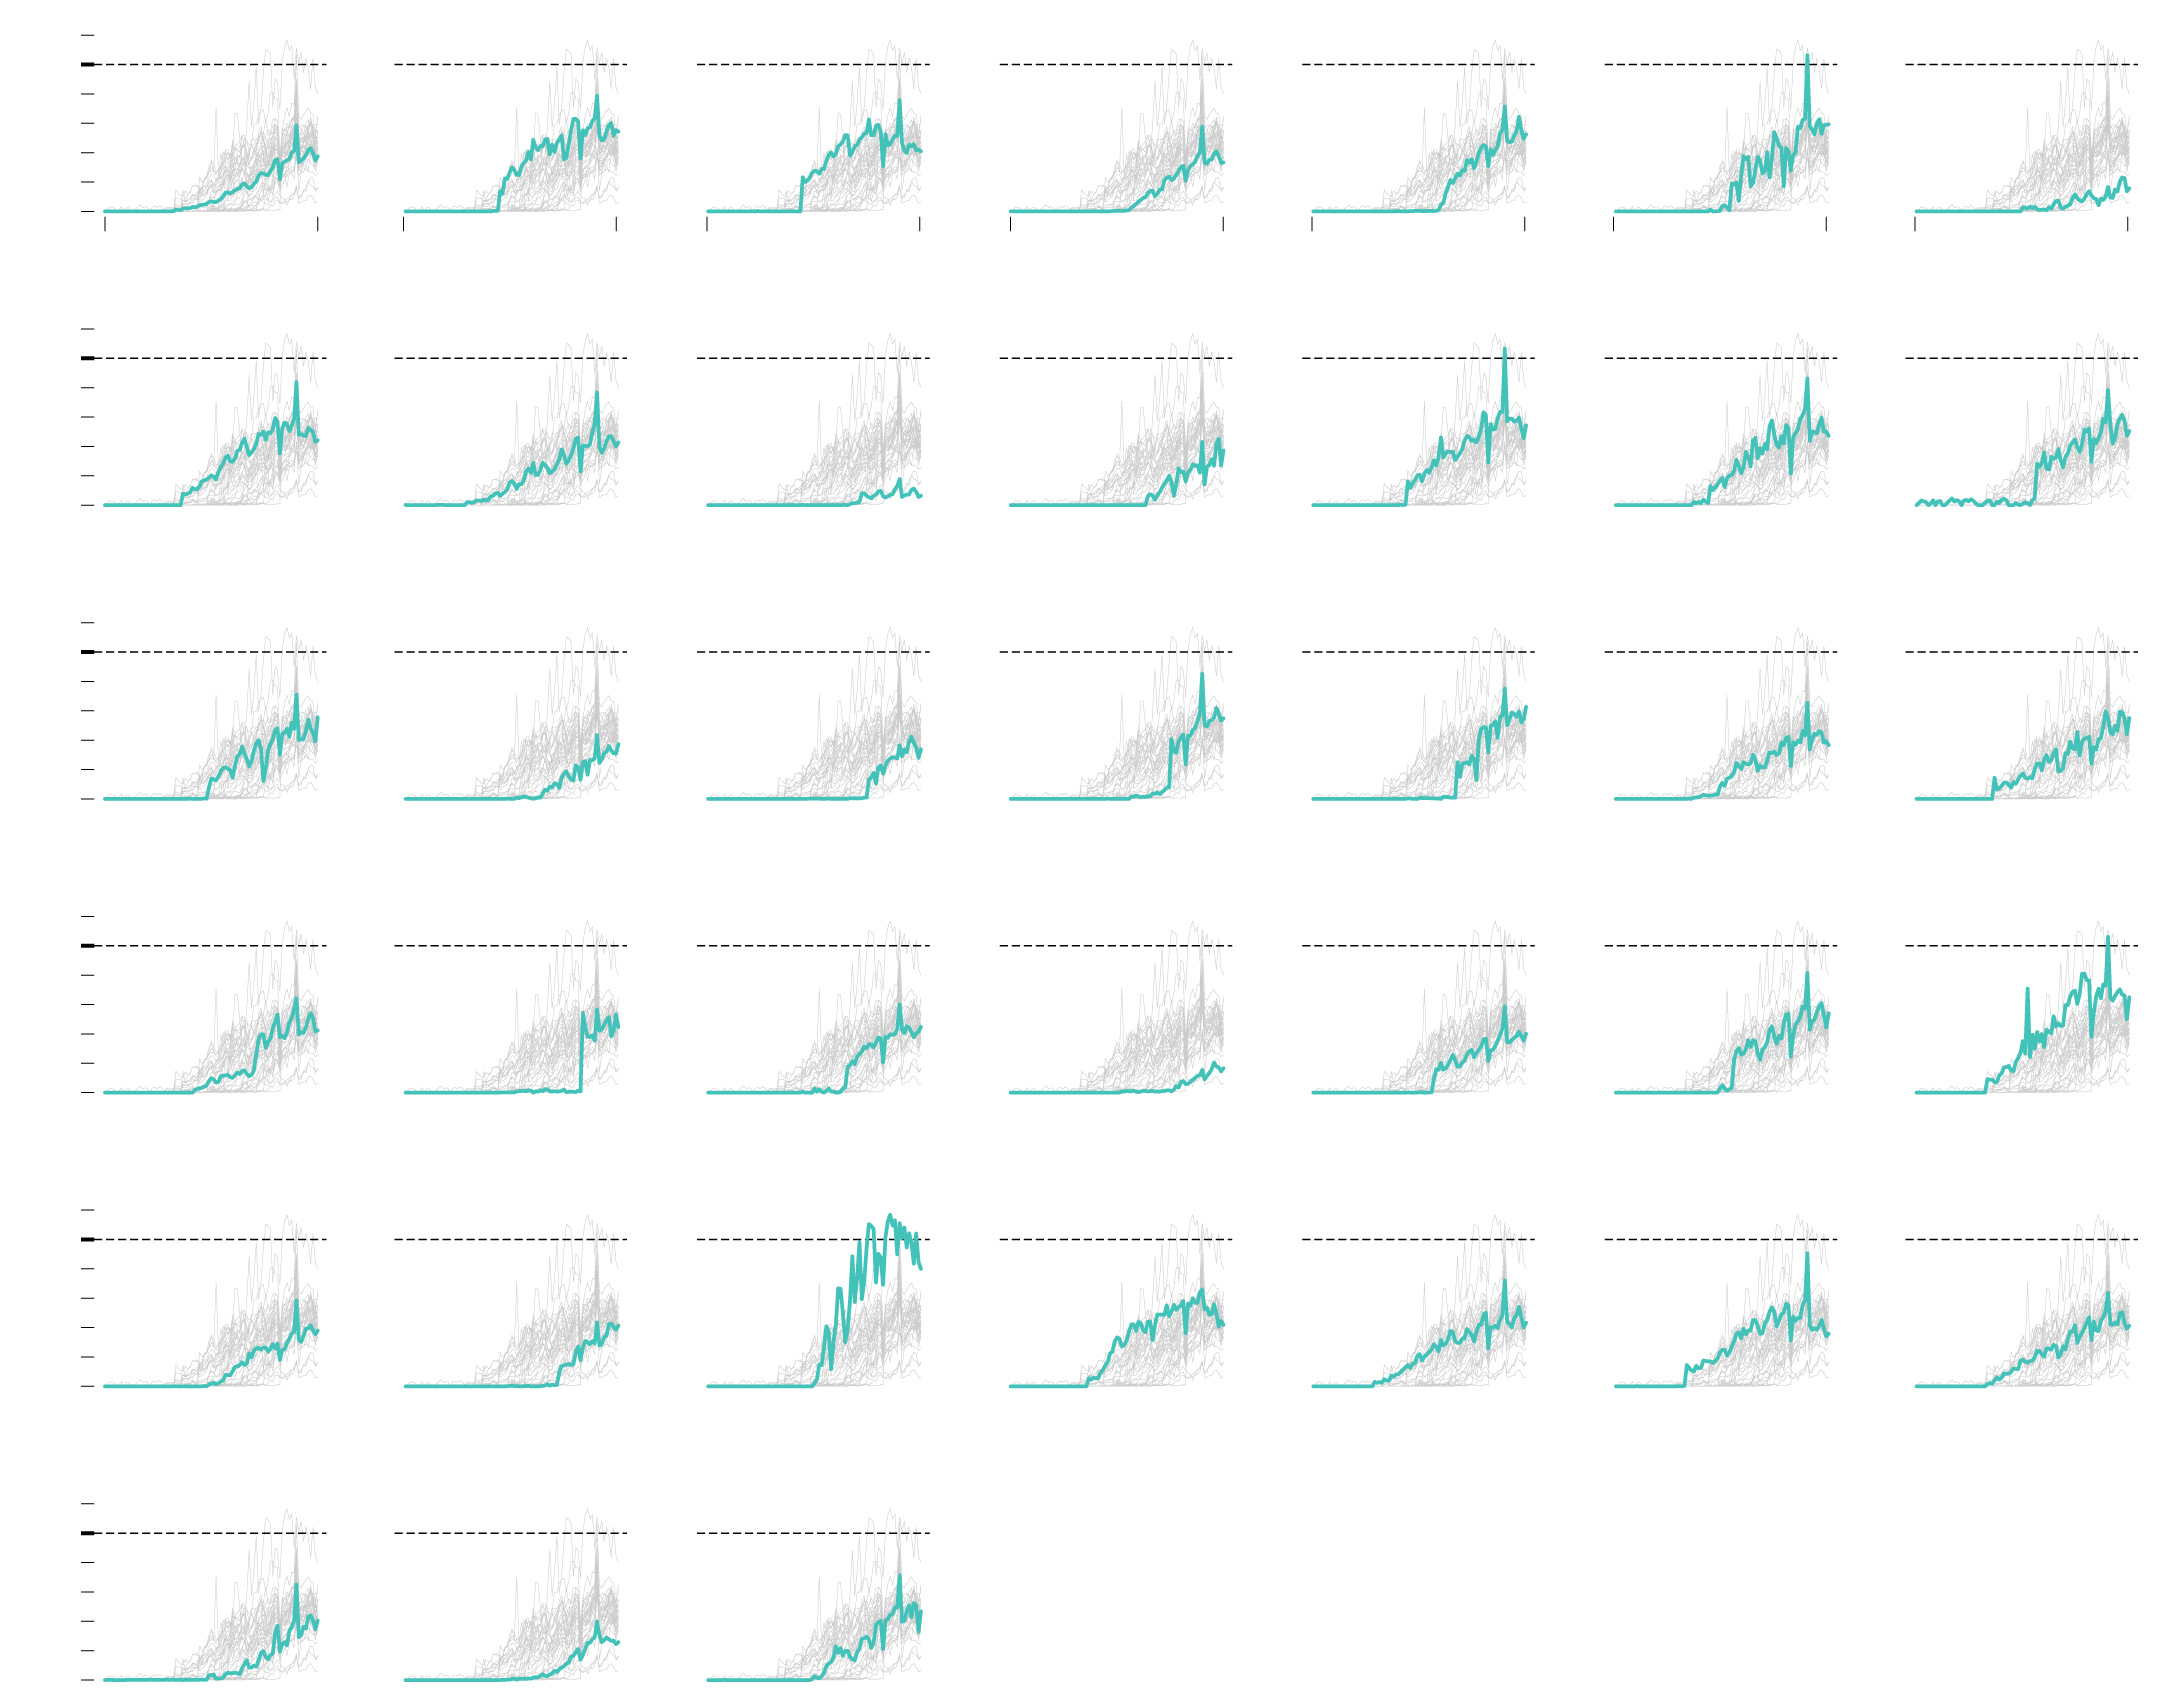
Restaurant Reopenings, a Comparison to Last Year
Restaurants are reopening for dining across the United States. Some states are doing it faster than others. Based on OpenTable data, the charts below show this year’s seated diners compared against last year’s for April 1 through June 30, 2020.
United States
Alabama
Arizona
California
Colorado
Connecticut
District of Columbia
+20%
0%
Same as 2019
Father’s Day spike
−20%
Dine-in reopens on May 11
No reservations
−100%
Apr 1
June 30
Apr 1
June 30
Apr 1
June 30
Apr 1
June 30
Apr 1
June 30
Apr 1
June 30
Apr 1
June 30
Florida
Georgia
Hawaii
Illinois
Indiana
Kansas
Kentucky
+20%
0%
Another big Father’s Day spike
−20%
Dine-in reopens on May 22
Staying low. Because of low tourism?
−100%
Louisiana
Maryland
Massachusetts
Michigan
Minnesota
Missouri
Nebraska
+20%
0%
−20%
Outdoor dining reopens June 1
June 8 reopenings
−100%
Nevada
New Jersey
New Mexico
New York
North Carolina
Ohio
Oklahoma
+20%
0%
−20%
May 18 spike?
Sudden bump on June 15 with reopenings
Casinos reopened on June 4
Dine-in reopens on May 21
Low but slowly coming back.
−100%
Oregon
Pennsylvania
Rhode Island
South Carolina
Tennessee
Texas
Utah
+20%
0%
Back up to last year’s levels
−20%
−100%
These show at-restaurant dining activity compared against the previous year. Only states with at least 50 restaurants that use OpenTable to handle seating or reservations are shown.
Virginia
Washington
Wisconsin
+20%
0%
−20%
SOURCE: OpenTable / MADE BY: FlowingData, https://flowingdata.com
−100%

United States
Alabama
+20%
0%
Same as 2019
−20%
No reservations
−100%
Apr 1
June 30
Apr 1
June 30
Arizona
California
+20%
0%
−20%
Dine-in reopens on May 11
−100%
Colorado
Connecticut
+20%
0%
Father’s Day spike
−20%
−100%
Florida
District of Columbia
+20%
0%
−20%
−100%
Georgia
Hawaii
+20%
0%
−20%
Staying low. Because of low tourism?
−100%
Illinois
Indiana
+20%
0%
Another big Father’s Day spike
−20%
−100%
Kansas
Kentucky
+20%
0%
−20%
Dine-in reopens on May 22
−100%
Louisiana
Maryland
+20%
0%
−20%
−100%
Massachusetts
Michigan
+20%
0%
−20%
June 8 reopenings
−100%
Minnesota
Missouri
+20%
0%
−20%
Outdoor dining reopens June 1
−100%
Nevada
Nebraska
+20%
0%
−20%
Casinos reopened on June 4
−100%
New Jersey
New Mexico
+20%
0%
−20%
Sudden bump on June 15 with reopenings
−100%
New York
North Carolina
+20%
0%
−20%
Low but slowly coming back.
−100%
Ohio
Oklahoma
+20%
0%
−20%
May 18 spike?
Dine-in reopens on May 21
−100%
Oregon
Pennsylvania
+20%
0%
−20%
−100%
Rhode Island
South Carolina
+20%
0%
Back up to last year’s levels
−20%
−100%
Tennessee
Texas
+20%
0%
−20%
−100%
Virginia
Utah
+20%
0%
−20%
−100%
Washington
Wisconsin
+20%
0%
−20%
−100%
These show at-restaurant dining activity compared against the previous year. Only states with at least 50 restaurants that use OpenTable to handle seating or reservations are shown.
SOURCE: OpenTable
MADE BY: FlowingData, https://flowingdata.com
A 0% difference means seated dining is the same as last year. A -100% difference means everything is shutdown.
Some states, such as Washington, Oregon, and California, are gradually reopening. Other states, such as Michigan, Nevada, and New Jersey, reopened more suddenly with big jumps on a single day. Rhode Island appears to be back up to 2019 levels.
For most of the states, there is a spike on June 21, which was Father’s Day. You might also notice dips one week before on June 14, which is because Father’s Day was one week earlier in 2019.
I’m not sure what happened in Oklahoma on May 18.
Notes
- You can grab the OpenTable data here, which has been updating daily.
- The charts were made with R and Adobe Illustrator.
Chart Types Used


Become a member. Support an independent site. Get extra visualization goodness.
See What You Get