Married People Have More Sex

There’s a recurring joke on sitcoms and comedy bits about a decline in sex life after marriage. The relationship and dynamics change. Less lust, more companionship. Is that really how it works?
It seems like married people would have sex more often, simply out of convenience. There is always someone there.
I was curious. The General Social Survey, which has run since 1972, was my route to the answer. I looked at responses from 2010 through 2016. As it’s a survey and not a lab experiment, there are the usual caveats with self-reporting, but the trends seem to make sense.
The survey asks a ton of questions, but the one of interest was: “About how often did you have sex during the last 12 months?” There are seven choices that range from not at all to four or more times per week.
Let’s start with the overview and then get into it.
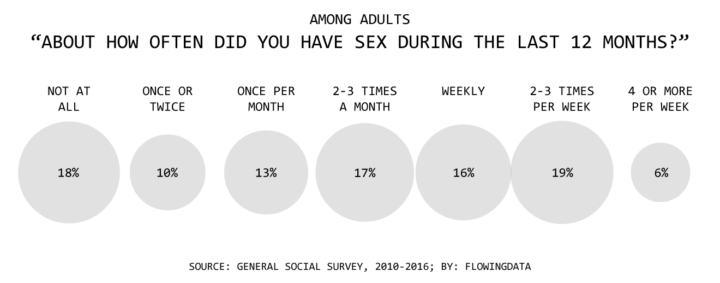
When you look at all adults, the responses are fairly even across, with the exception of the six percent who answered 4 or more times per week. There also seems to be a slight split between having no sex at all and having sex regularly. The once per month and once or twice over the year were answered less often than the others.
We need demographic breakdowns though to see something more useful (and to make sure this data makes sense).
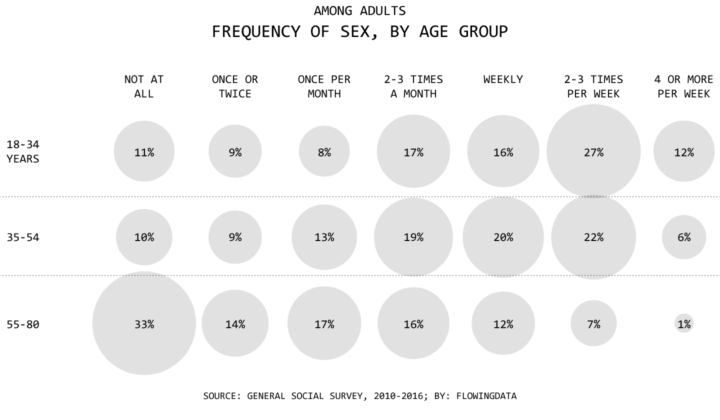
The above shows responses by age. Generally speaking, I expect younger people had more sex and older people had less sex. This is what we see, so the data seems to make sense.
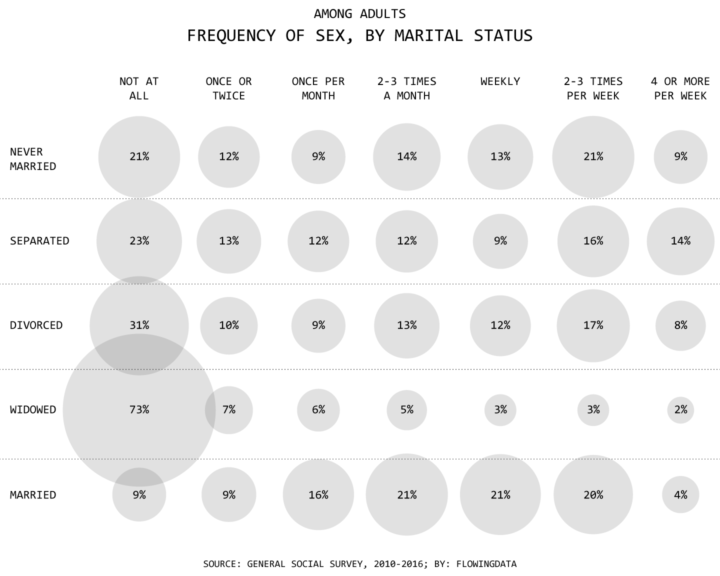
Now let’s look at the rates by marital status. The standout data point is the 73 percent of widowed individuals who answered “not at all.” This should not surprise, given the combination of age and loss of partner. The never married, separated, and divorced look similar to the overall percentages.
As for the married folk, the bulk (62 percent) is in the 2 to 3 times per month to the 2 to 3 times per week range. The 4 or more times per week percentage is lower than the other non-widow groups though.
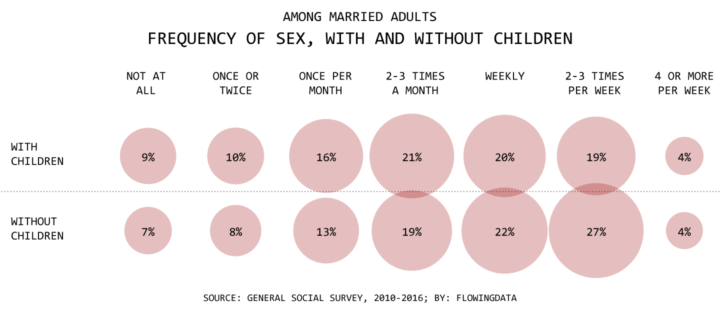
As the schoolyard song goes: “First comes love, then comes marriage, then comes baby in the baby carriage.” Sex 2 to 3 times per week is more common for those without children. Is it because of the kids or because of age though? Most people wait a few years before trying for kids.
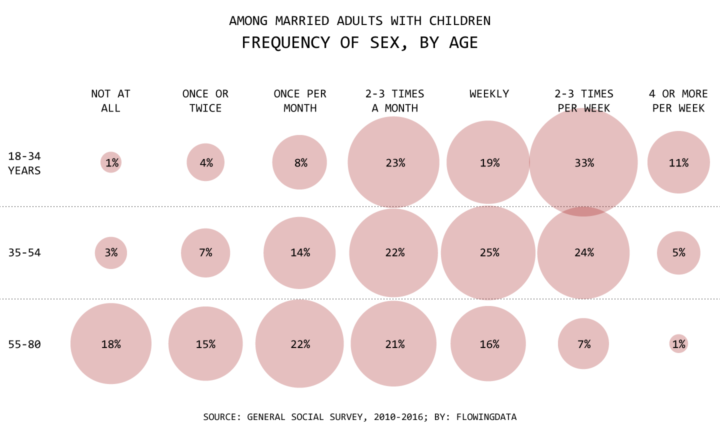
When you break down the married adults with children into age groups, the higher frequency for younger people becomes obvious again. It seems that having kids correlates more to age than to sex frequency.
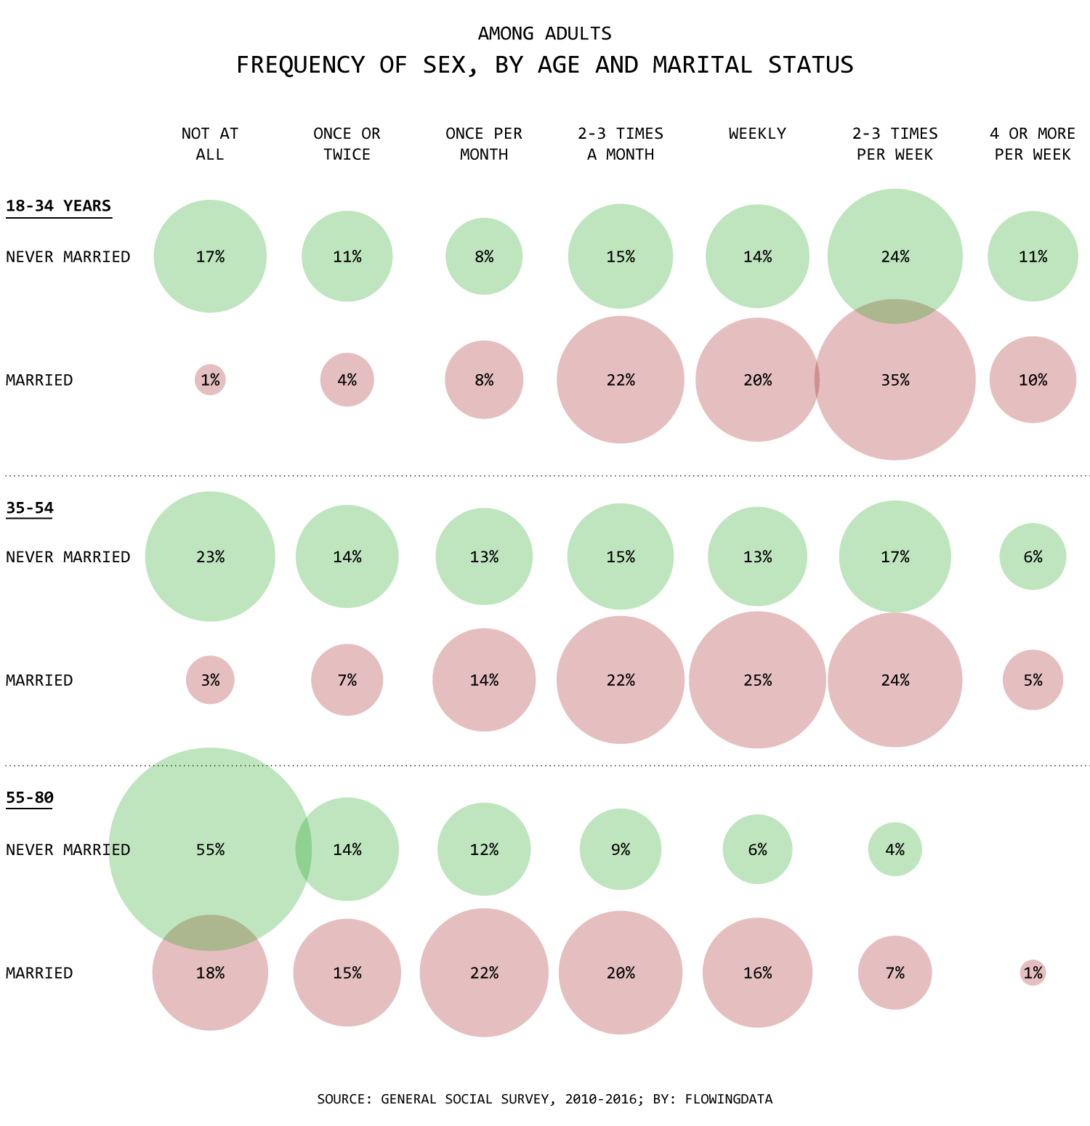
So we look at just age again. But this time compare married and never married for each age group. The higher sex frequencies are more common for married people in each age group.
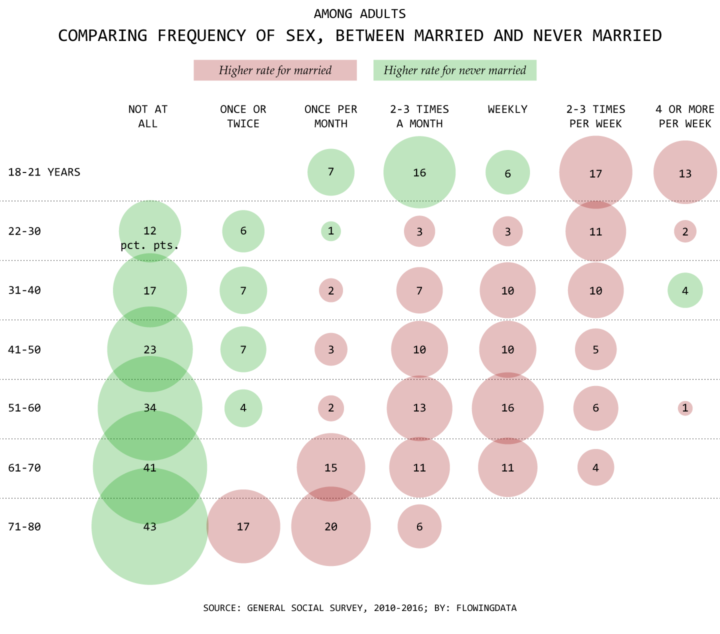
This is more clear with a direct comparison. The above shows the percentage point difference between never married and married for each age category. I shrank the age group ranges (therefore creating more age groups) since age appears to be such a significant factor. With more red on the right, it still looks like married folks have sex more often.
I thought maybe if you only look at people who said they had sex more than once or twice in a year, the distributions for married and never married might look more similar. A little bit, but the differences and higher sex frequencies for married people are still obvious.
If you only look at those who had sex four or more times per week over a 12-month period, things get noisy. The high frequency is not as common, so it’s kind of a crapshoot in terms of the data. Other than that though, it appears married people have more sex.
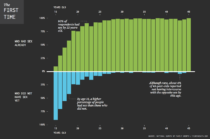 When Straight Americans Lost Their Virginity
Thinking about the first time.
Notes
- Like I said, since this is a survey, you have to take the answers with a grain of salt, especially since the question is about sex. I don’t have research to cite, but I’m pretty sure people tend to exaggerate a tad. Do married people exaggerate more? Do single people exaggerate less? I don’t know. But the trends make sense, right?
- The data from the General Social Survey is publicly available in various places on the interwebs. I downloaded it from the Berkeley Survey Documentation and Analysis archive. It’s not the most usable thing in the world, but it gets the job done.
- I made the charts in R.
- I could have used stacked bars instead of circles to show values, but I don’t really like them for more than two or three categories. Circles have their own issues, but I included the actual values to offset those a bit.
Chart Type Used

Become a member. Support an independent site. Make great charts.
See What You Get