GOOD Magazine’s most recent infographic (above and below) on consumer spending got me to thinking about all the other approaches I’ve seen on the same topic. The number of ways to attack a dataset never ceases to amaze me, so I dug a little. Yeah, there are a bunch – but here are some of the good ones. Got some more? Leave a link in the comments.
Here’s the full GOOD Magazine consumer spending graphic in the style that we’ve grown accustomed to:

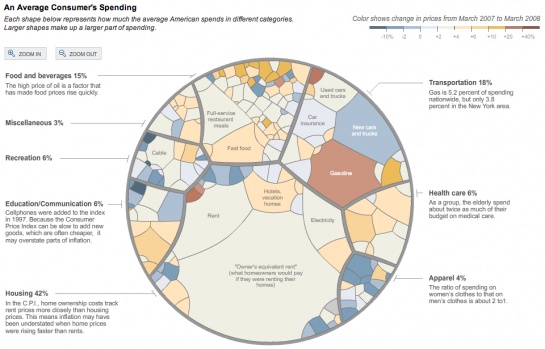
There’s this stained glass looking one, or rather a Voronoi Treemap, from The New York Times. It shows the breakdown for American consumer spending:

The Times also gave the force-directed graph a whirl to display worldwide spending:

Peter Berstein gets into how the Forbes 400 spend their fortunes in his book All the Money in the World:

Arno Ghelfi uses a spruced up tree map to show American spending on technology in this post for Wired Magazine:

Finally, how can you discuss finances and consumer spending without a few charts and graphs?


 Visualize This: The FlowingData Guide to Design, Visualization, and Statistics (2nd Edition)
Pingback: ThickCulture » ThickLinks 1-1-09
Pingback: Reading 01/02/09 | Venture Capital Bloggers Network
Pingback: 9 Ways to Visualize Consumer Spending
Pingback: Dude- Where’s My Money? A look at Consumer Spending… | Saving Mommy Money
Pingback: Interesting blog post « SLU Public Finance Spring 2009
Pingback: Financial Visualizations - sorry, long post & there are quite a few links « tempvis
Pingback: The best of Data Flow « Infografia em base de dados
Pingback: An overiew on interesting ways to display how we burn out… — Some Random Dude