For New York Times Magazine, Devin Gordon profiled popular oddsmaker Mazi VS, a…
outlier
-
Odds against a sports betting king
-
Members Only
Smell Test for Data
The first part of visualizing data usefully is making sure the data you’re working with is not terrible.
-
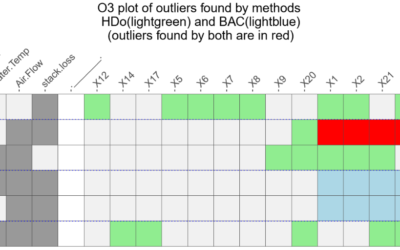
Outlier detection in R
Speaking of outliers, it’s not always obvious when and why a data point…
-

Visualizing Outliers
Step 1: Figure out why the outlier exists in the first place. Step 2: Choose from these visualization options to show the outlier.
-
Out, liar.
By Ben Shabad, full-time graduate student and part-time cartoon-drawing person.…
Recently for Members
Second Edition
 Visualize This: The FlowingData Guide to Design, Visualization, and Statistics (2nd Edition)
 Visualize This: The FlowingData Guide to Design, Visualization, and Statistics (2nd Edition)
New tools, refined process.
Browse by Chart Type See All →


