This week we sort the dots and look closer at the things we can control.
interaction
-
Members Only

Sort the dots, like a table
-
Members Only

Making of: Salary and Occupation beeswarm charts
I refreshed an old project with new data and interactions. This week we walk through the steps.
-
Members Only
Letting the Data Play Through
Show all the data at once so that you can see a full trend efficiently, but show a bit at a time and show how the data builds.
-
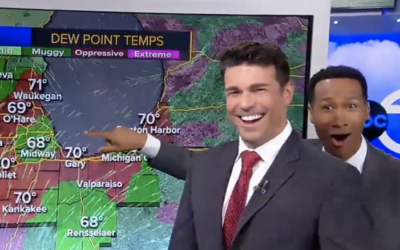
Meteorologist delighted by surprise map interaction
Meteorologist Greg Dutra was delivering the daily weather news for ABC Chicago and…
-

Hands-On Data Visualization, an open-access book on interactive visualization for beginners
Hands-On Data Visualization, by Jack Dougherty and Ilya Ilyankou, is an open-access book…
-

How Humans Judge Machines
How Humans Judge Machines is an academic publication covering the results of experiments…
Recently for Members
Second Edition
 Visualize This: The FlowingData Guide to Design, Visualization, and Statistics (2nd Edition)
 Visualize This: The FlowingData Guide to Design, Visualization, and Statistics (2nd Edition)
New tools, refined process.
Browse by Chart Type See All →


