Unit Chart
A symbol is used for each unit to place emphasis on individuals or objects.
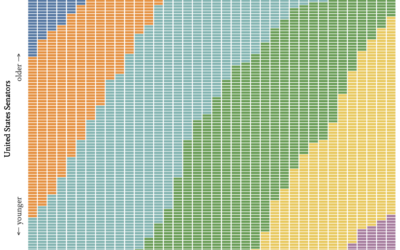
Age generations in the U.S. Senate, over time
With this straightforward unit chart, wcd.fyi shows which generation each Senate member belonged…
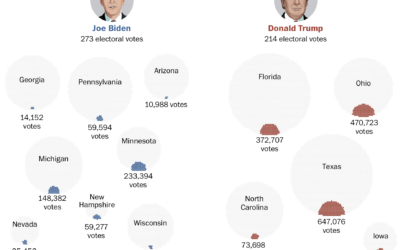
Votes that won the presidency
Voter turnout this election was higher than it’s been in a long time,…
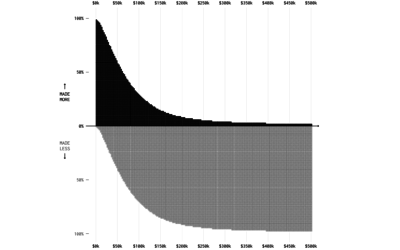
Who Makes More Money
Someone mentioned that $400,000+ per year was commonplace in American households. That seemed like an odd comment.
Millions of people experienced unhealthy air in 2020
NPR estimated how many people have experienced unhealthy air this year, largely in…
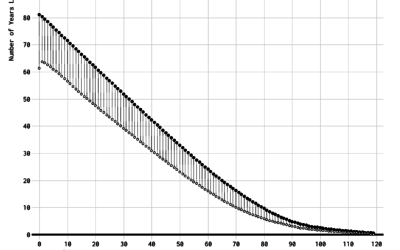
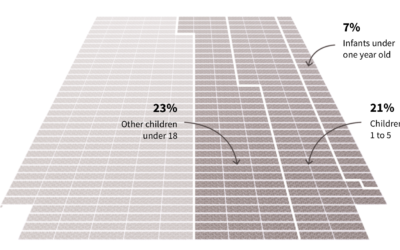
Redefining Old Age
What is old? When it comes to subjects like health care and retirement, we often think of old in fixed terms. But as people live longer, it's worth changing the definition.
Best Directors Who Were Not White Men
From 1928, the year of the first Academy Awards, to 2019, there have been 455 nominations for Best Director. Of those, 18 of them went to non-white men.
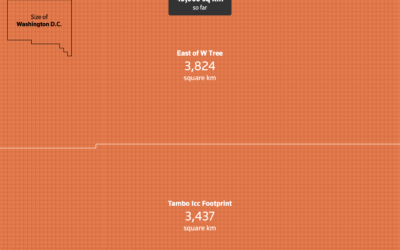
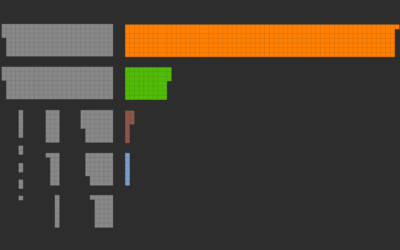
Scale of Australia bushfires shown with unit charts
Outside of Australia, it can be a challenge to get a grasp of…
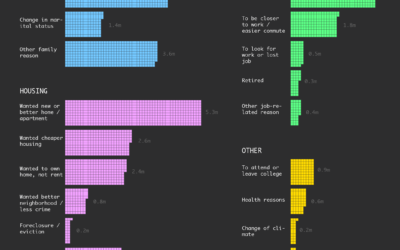
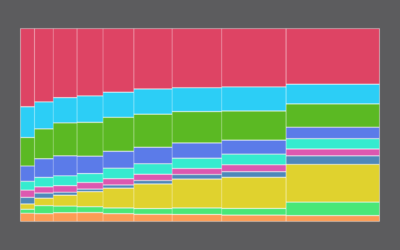
Why People Move
Here are the estimates from the Current Population Survey for the most recent time segment between 2017 and 2018.
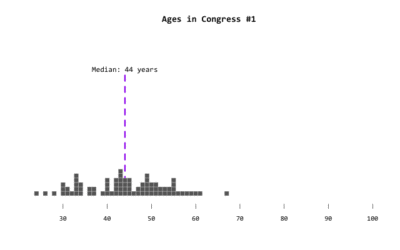
Ages in Congress, from the 1st to the 115th
As I watched Google’s CEO Sundar Pichai field questions from the House Judiciary…
One Drink Per Day, Your Chances of Developing an Alcohol-Related Condition
While a drink a day might increase your risk of experiencing an alcohol-related condition, the change is low in absolute numbers.
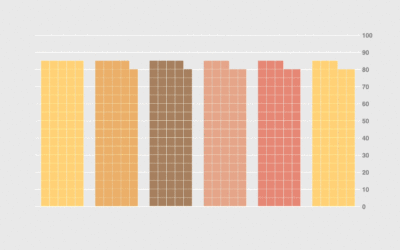
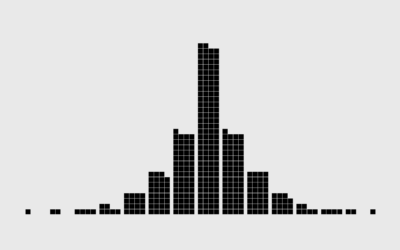
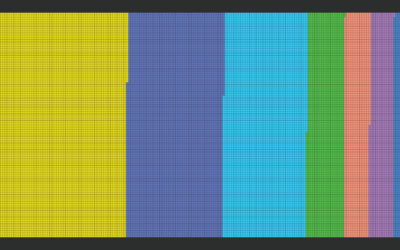
How to Make a Tiled Bar Chart with D3.js
Show individual data points by splitting bars into smaller cells.
How to Make Unit Charts with Icon Images in R
Make the unit chart less abstract with icons that represent the data, or use this in place of a bar chart.
How Different Income Groups Spend Money
After living expenses, where does the money go, and how does it change when you have more cash available?
Symbols-based Unit Charts to Show Counts in R
Add visual weight by using individual items to show counts.
Giving Up Time as a Parent
There is a fixed number of minutes during the day. Where do parents usually draw the time from?
How the Average Working Adult Spends Days
This is what you get when you add up all the days the average American adult spends sleeping, eating, commuting, and doing other activities.
How You Will Die
So far we've seen when you will die and how other people tend to die. Now let's put the two together to see how and when you will die, given your sex, race, and age.

