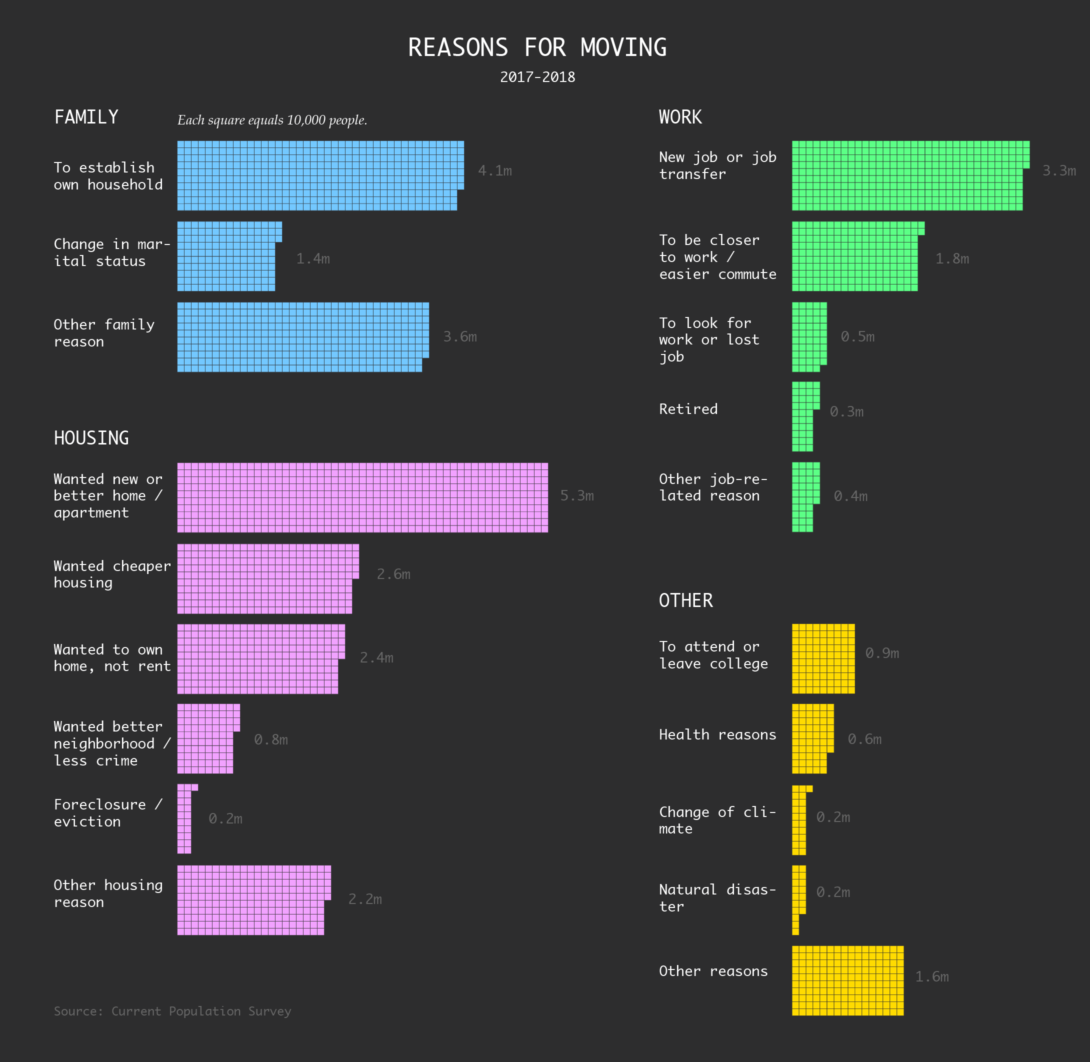
The Current Population Survey tracks mobility and migration in the United States. Since 1999, its asked for the reasons people moved from one place to the other. Here are the estimates for the most recent time segment between 2017 and 2018.

Notes

Become a member. Support an independent site. Make great charts.

See What You Get

Learn to Visualize Data See All →

How to Map and Use GeoTIFF Files in R

It’s like working with a bunch of tiny dots, and oh look, all of sudden patterns emerge.

Annotating Charts in R

Let the data speak for itself they say. That doesn’t work a lot of the time, and when that happens, you need to explain.

Symbols-based Unit Charts to Show Counts in R

Add visual weight by using individual items to show counts.

Build Interactive Area Charts with Filters

When you have several time series over many categories, it can be useful to show them separately rather than put it all in one graph. This is one way to do it interactively with categorical filters.

Favorites

All the Household Types in the U.S.

No need to restrict ourselves to the most common types. There are thousands. Let’s look at all of them.

Cycle of Many, a 24-hour snapshot for a day in the life of Americans

This is a 24-hour snapshot for a day in the life of Americans.

A Day in the Life of Americans

I wanted to see how daily patterns emerge at the individual level and how a person’s entire day plays out. So I simulated 1,000 of them.

Reviving the Statistical Atlas of the United States with New Data

Due to budget cuts, there is no plan for an updated atlas. So I recreated the original 1870 Atlas using today’s publicly available data.