One Drink Per Day, Your Chances of Developing an Alcohol-Related Condition

The headline-grabbing conclusion to a recent study was that not just heavy drinking — all levels of alcohol consumption — are bad for you, which of course is in direct contrast to previous studies that suggested a glass of wine or a beer every now and then were good for your heart. What a bummer.
But wait. David Spiegelhalter talked about the actual risk numbers instead of the headlines and concluded: “Come to think of it, there is no safe level of living, but nobody would recommend abstention.”
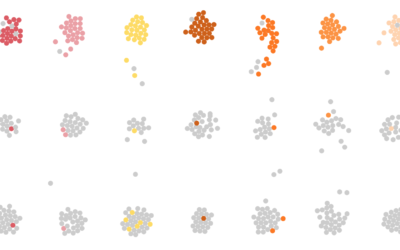
While a drink a day might increase your risk of developing one of the 23 alcohol-related diseases specified in the paper, the increased risk is still low. In a group of 100,000 people who consume one drink per day, 918 would likely experience an issue. Of those 918, only 4 would come about because of the drinks.
One Drink Per Day
Comparing 100,000 people who consume one alcoholic drink per day against those who completely abstain…

4 additional people would likely experience an alcohol-related condition.
914 would experience a condition anyways.
The remaining 99,082 others would probably not develop a condition.
So yeah, the risk is pretty low, especially when you compare it to the other things we do like drive cars, eat not-so-healthy food, or, you know, step out of the house.
Also, the study was a meta-analysis using observational data from previous studies. While it has its merits, this means the researchers could not account for confounding factors like those who drink and smoke or exercise levels across varying drinking levels.
All I could think of was the song YOLO by The Lonely Island:
But! Let’s say the risk estimates for moderate drinking are worthwhile.
Maybe the numbers aren’t that high at the individual level, but if you’re going to look at it from that angle, it’s only fair to step back and scale up. Instead of 100,000 people, imagine 10 million people instead. That’s 400 additional people who develop an alcohol-related condition.
Prevention
Out of 10 million people, 400 additional people would likely experience an alcohol-related condition.

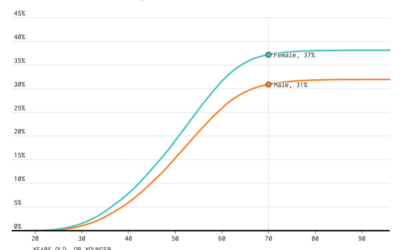
Keep scaling up to national populations, and maybe the small percentages for heart disease and cancer don’t seem so trivial anymore.
I think the lesson here is moderation. But if alcohol ends up to be healthy, then hey, I’m all for it.
Become a member. Support an independent site. Make great charts.
See What You Get


