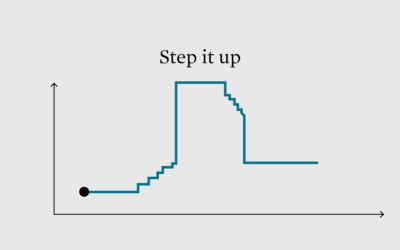
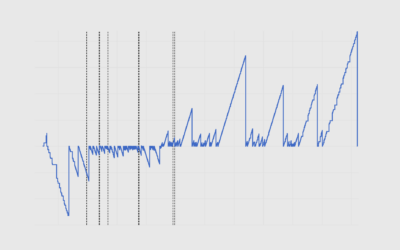
It works like a line chart, but the values change immediately at the x-coordinate instead of with a slope.
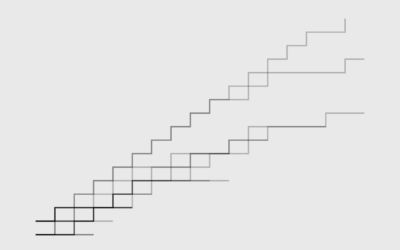
This week we look at the step chart and how to highlight specific patterns in the steps.
For the times your data represents immediate changes in value.
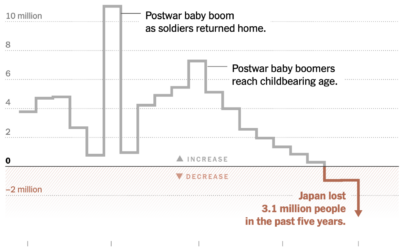
Japan has been aging and having fewer children, which led to a decline…
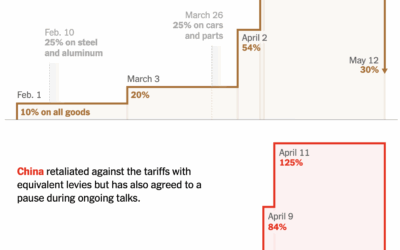
The U.S. and China put a semi-hold on tariffs for the next 90…
For Bloomberg, Zoe Tillman and Christopher Cannon break down the lawsuits against the…
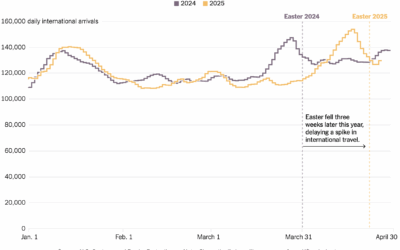
For the New York Times, Josh Holder, Niraj Chokshi, and Samuel Granados use…
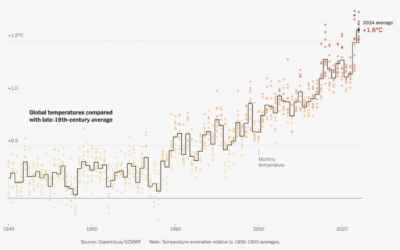
This is some good step charting by Mira Rojanasakul for the New York…
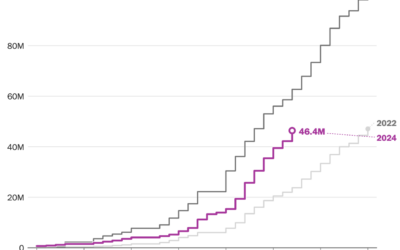
Early voting isn’t coming in as hot as in 2020, but there are…
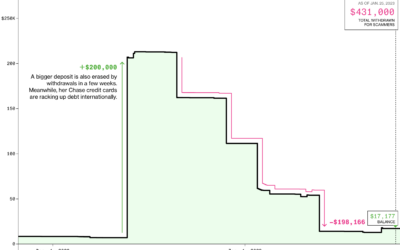
Annette Manes, a retired widow and single mother who saved by spending little,…
After years of enthusiastic discussions, editors eventually and begrudgingly came to a conclusion.
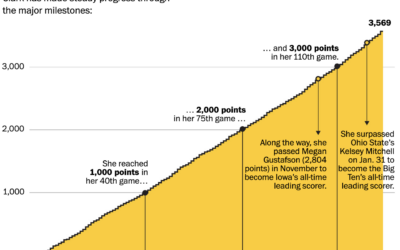
Caitlin Clark, a basketball guard for the University of Iowa, has been steadily…
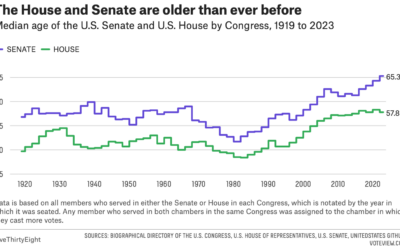
For FiveThirtyEight, Geoffrey Skelley digs into the ongoing trend: What’s behind these increasingly…
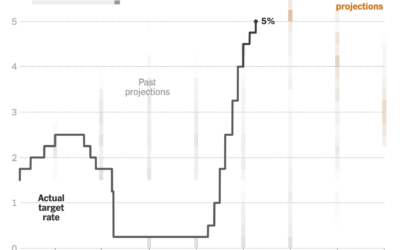
This clever chart by Lazaro Gamio shows changing interest rates set by the…
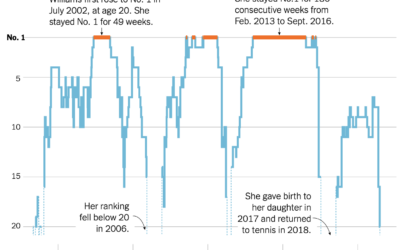
Serena Williams announced her retirement from professional tennis. As is required for any…
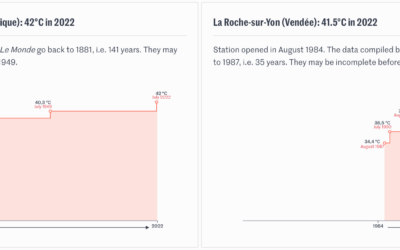
Speaking of the heat wave in Europe, Pierre Breteau for Le Monde charted…
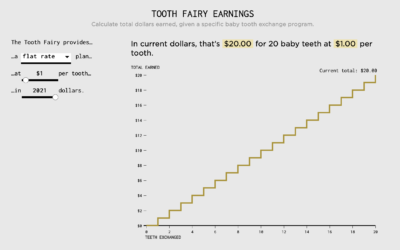
Calculating how much money a kid gets after exchanging all twenty baby teeth.
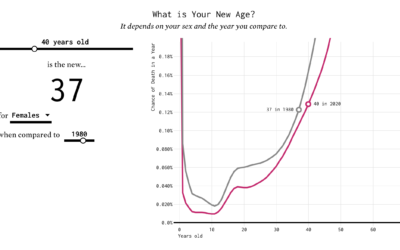
You've probably heard the lines about how "40 is the new 30" or "30 is the new 20." What is this based on? I tried to solve the problem using life expectancy data. Your age is the new age.
Twitter was hacked yesterday. Over a few hours, prominent accounts were tweeting that…