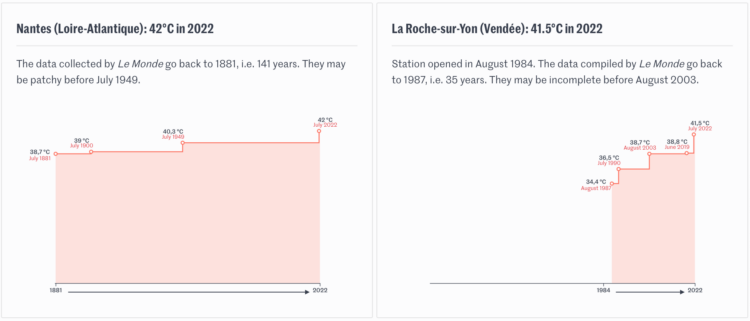
Speaking of the heat wave in Europe, Pierre Breteau for Le Monde charted record high temperatures using a step chart for each weather station in France:
These graphs represent, for a part of the 146 stations for which Météo-France provided us with the data, the level of the most extreme temperatures ever recorded and their date.
The data are fragmentary because it is difficult to go back beyond the 1990’s, or even the August 2003 heat wave, and only those with a historical record of at least 20 years are shown below.

 Visualize This: The FlowingData Guide to Design, Visualization, and Statistics (2nd Edition)