Visualization
Showing the stories in data through statistics, design, aesthetics, and code.
Pixelation to represent endangered species counts
In 2008, the World Wildlife Fund ran a campaign that used pixelation to…
Detailed generative art in R
Thomas Lin Pedersen has been sharing his generative art pieces as of late:…
Street suffixes show the organization of cities
The suffixes on street names can say a lot about a neighborhood. A…
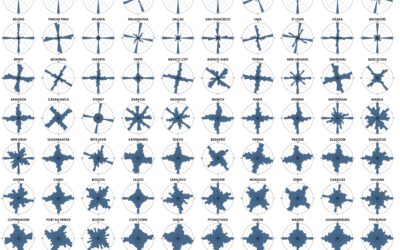
Analysis of street network orientation in cities
Continuing his analysis of street grid-iness in cities around the world, Geoff Boeing…
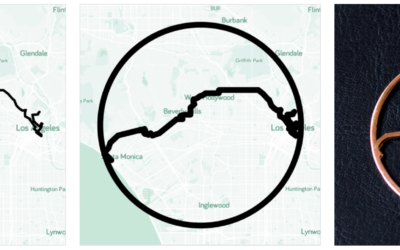
Jewelry based on your GPS traces
GPX Jewelry by Rachel Binx lets you turn your GPS traces into jewelry.…
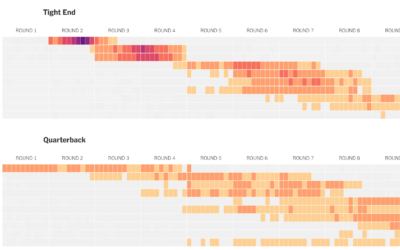
How well players drafted in fantasy football
For The Upshot, Kevin Quealy used a heatmap to visualize fantasy football draft…
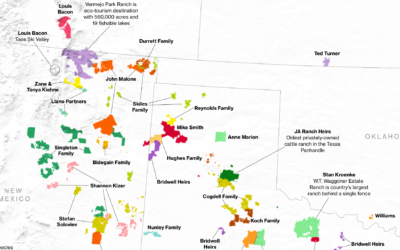
Who owns the most land in the U.S.
Bloomberg News mapped the land owned by the largest owners:
The 100 largest…
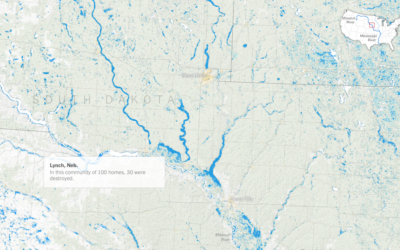
Sprawling flood waters across the Midwest and South
The New York Times mapped the slow, wide-reaching flood waters this year so…
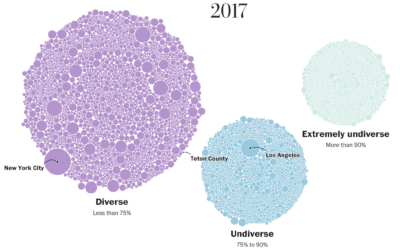
School diversity visualized with moving bubbles
The Washington Post visualized 13,000 school districts to show the change in diversity…
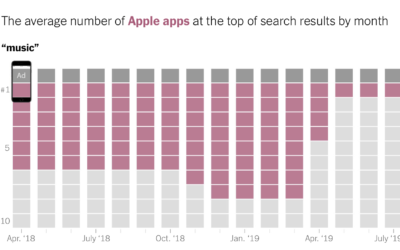
Stacking Apple apps in the App Store
For The New York Times, Jack Nicas and Keith Collins stack up app…
A sim to show self-driving car challenges
On the surface, driving a car might seem fairly straightforward. Follow the rules…
All of the plastic bottles purchased in a day, Eiffel Tower for scale
Millions of plastic bottles are purchased every day around the world. What does…
Looking at the Amazon fires wrong
For The Washington Post, Sergio Peçanha and Tim Wallace use maps to show…
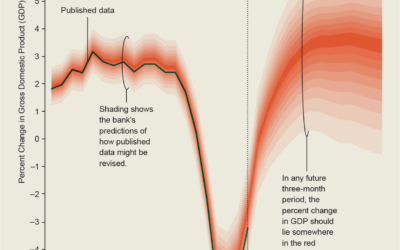
Gallery of uncertainty visualization methods
It must be uncertainty month and nobody told me. For Scientific American, Jessica…
What that hurricane map means
For The New York Times, Alberto Cairo and Tala Schlossberg explain the cone…
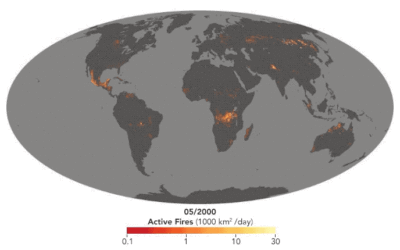
Map shows long-term record of fires around the world
For the NASA Earth Observatory, Adam Voiland describes about two decades of fires:…
Cartogram of where presidential candidates campaign
Presidential candidates campaign harder in some states more than others. National Popular Vote…
Where and why the Amazon rainforest is on fire
For Bloomberg, Mira Rojanasakul and Tatiana Freitas discuss why the Amazon rainforest is…


