Visualization
Showing the stories in data through statistics, design, aesthetics, and code.

Mapping tree loss in rain forests over time
Bloomberg mapped tree loss between 2000 and 2019 in Brazil:
“What we have…
Voting guide for your state
The Washington Post provides another straightforward voting guide, based on where you live…

Disappearing animals as a matrix of dots
Reddit user WhiteCheeks used dot density to show population counts of various animals.…
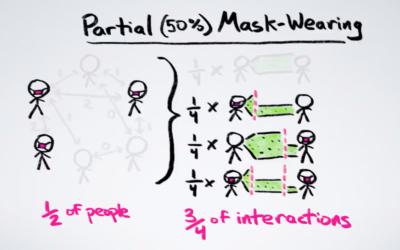
Math behind wearing masks
The math behind wearing a mask can seem unintuitive at times. Minute Physics…
Design your own election scenario
As we have seen, small shifts in voting behavior of various demographic groups…
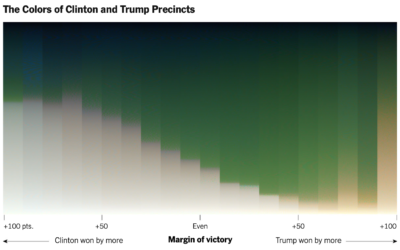
Red-blue electoral map and the green-gray in satellite imagery
For NYT’s The Upshot, Tim Wallace and Krishna Karra looked at how the…
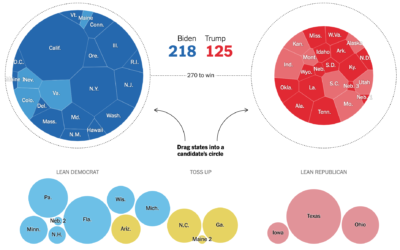
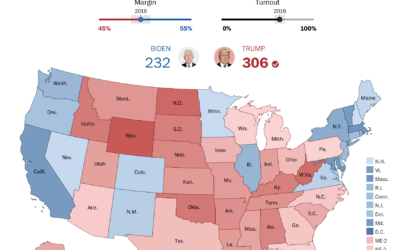
Choose your own election outcome
The election is full of what-ifs, and the result changes depending on which…
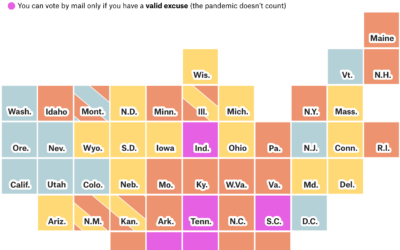
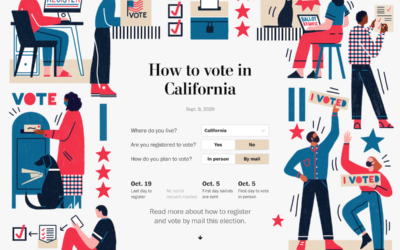
How to vote in each state
Each state is handling mail-in voting in a certain way with varying timelines…
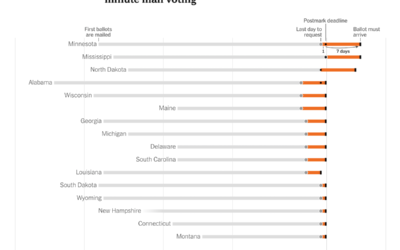
Time for last-minute mail voting
The New York Times provides a state-by-state chart timeline for voting by mail:…
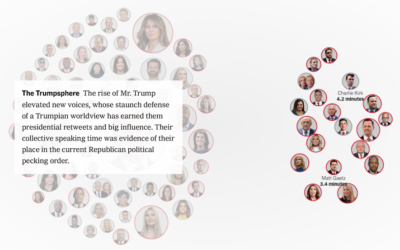
Minutes spoken at the Republican Convention
The New York Times provides a breakdown of minutes spoken at the Republican…
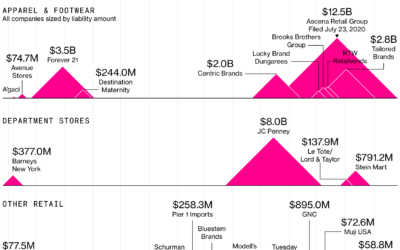
Dying mid-range mall
Bloomberg looks at how retail struggles might kill the middle-of-the-road malls before this…
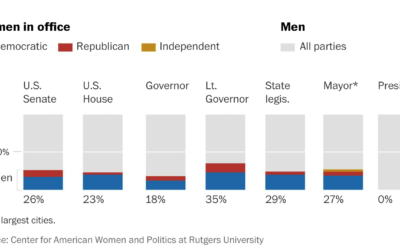
How long before there is gender equality in the U.S. House and Senate
For The Washington Post, Sergio Peçanha asks, “What will it take to achieve…
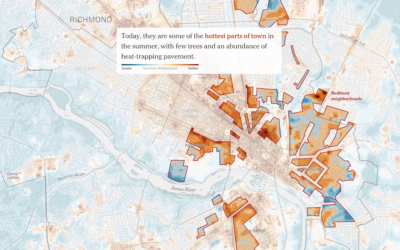
Racist housing policy from 1930s and present-day temperature highs
Brad Plumer and Nadja Popovich for The New York Times show how policies…
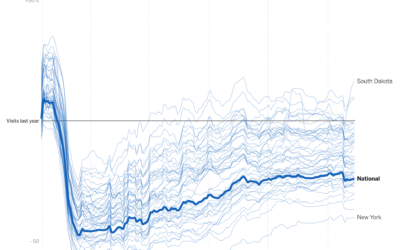
Visits to businesses compared year-over-year in each state
Businesses are still seeing visits mostly down compared to last year, which shouldn’t…
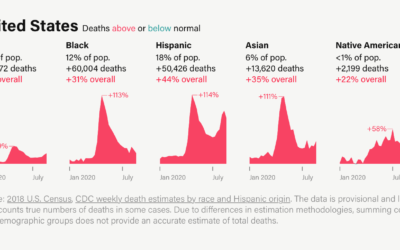
Excess deaths, by race
It’s clear that Covid-19 has affected groups differently across the United States. By…
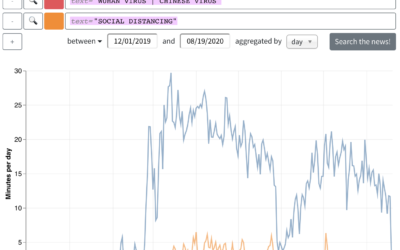
Analyzing the topics of cable TV news
From the Computer Graphics Lab at Stanford University, the results from an analysis…
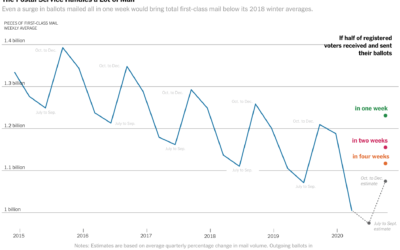
Vote-by-mail volume compared against years past
The volume of mail-in ballots will likely be higher than usual this year,…