Visualization
Showing the stories in data through statistics, design, aesthetics, and code.

Minute-by-minute timeline for what happened at the Capitol
The New York Times outlined the minutes from the speech leading to the…
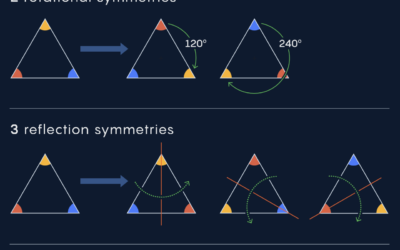
What is a particle?
Natalie Wolchover for Quanta Magazine asked several physicists what a particle is. She…
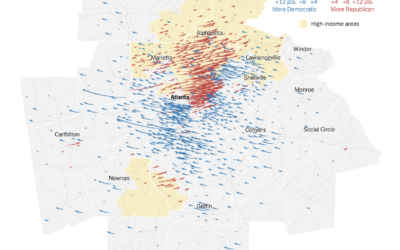
Map of the voting in Georgia, the runoff vs. the general election
For NYT’s The Upshot, Nate Cohn explains how Warnock and Ossoff won Georgia.…
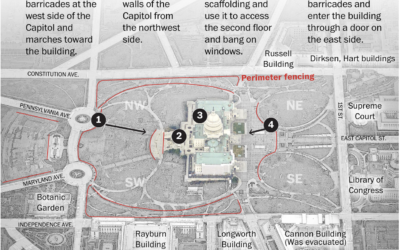
How the mob broke into the U.S. Capitol
The Washington Post pieced together video footage from multiple sources for a timeline…
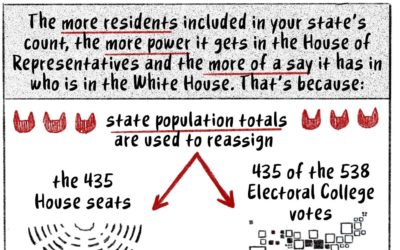
How the Census translates to power, a cat comic
State population dictates the number of seats in the House of Representatives, so…
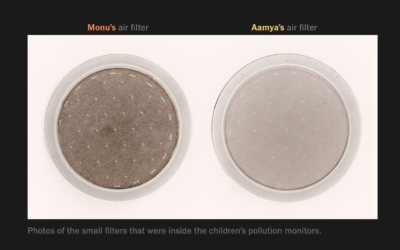
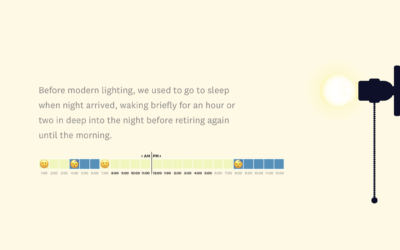
Pollution exposure plotted, a comparison between two kids’ day
The New York Times measured pollution exposure during the day for two kids…
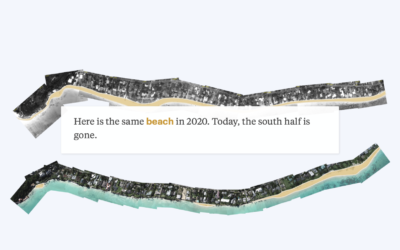
Mapping disappearing beaches in Hawaii
Ash Ngu for ProPublica and Sophie Cocke for Honolulu Star-Advertiser show the harm…

Reconstructing the killing of Breonna Taylor
The New York Times reconstructed the night. Based on a collection of court…

Best Data Visualization Projects of 2020
It's been a year. We saw a lot of charts. These are the best ones.
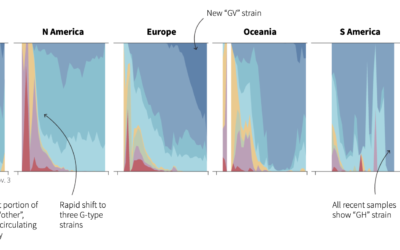
Evolution of coronavirus strains
Reuters looked at how seven main strains of the virus evolved around the…
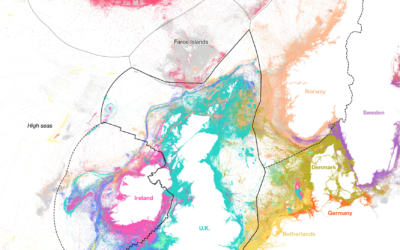
Who catches the most fish
Using data from Global Fishing Watch, Hayley Warren and Ian Wishart for Bloomberg…
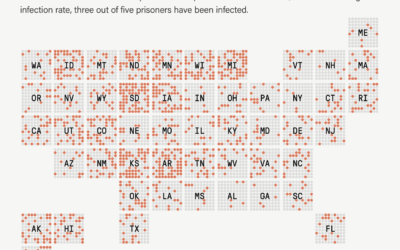
1 in 5 prisoners had Covid-19, a grid map
The Marshall Project and The Associated Press report on the Covid-19 rates in…
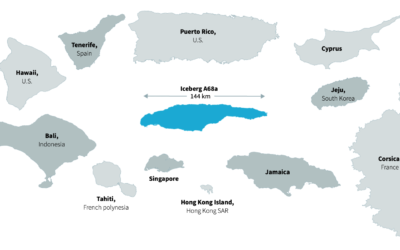
Tracking world’s biggest iceberg
The world’s biggest iceberg, A68a, is on track to crash into a remote…
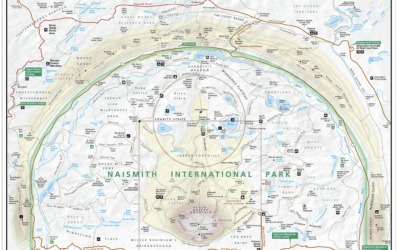
Basketball court designed as a national park map
Kirk Goldsberry, whose basketball charts you might recognize, made the Naismith International Park…

Infrared to show air particles from your talk hole
I’m sure you know this already, but just in case, air particles come…
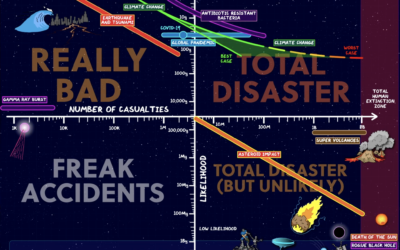
Charting and ranking apocalyptic events
For Domain of Science, Dominic Walliman attempts to chart all of the deadly…