Visualization
Showing the stories in data through statistics, design, aesthetics, and code.
Fleshmap: Studies of Desire – Touch, Look, and Listen
Fleshmap is a new project by Martin Wattenberg and Fernanda Viégas that explores…

Physical Graphs as Critique on American Culture
These wooden graphs by Joshua Callaghan show uh, something on the left and…
3 Worthwhile Alternatives to the Pie Chart
A while back I asked what you wanted to see more of on…
Tell Stories With Interactive Timelines from Dipity
Timelines, much like calendars, can be used to show changes over time in…
Is There a Market for Premium Online Data Visualization?
Visualization is coming out of the research lab and stepping into the market.
Awesome Olympics Coverage By The New York Times
Who else has been enjoying the Olympics as much as I have? I…
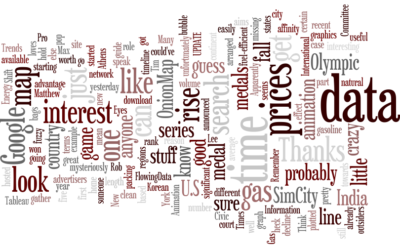
Many Eyes Adds Wordle to its Extensive Visualization Toolbox
I’m sure you’ve seen Wordle by now, which puts an artistic spin on…
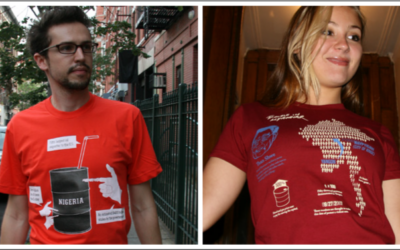
I’ll Take My Infographic in Bright Orange, Men’s Medium
The Shirt Project, by Rich Watts and Louise Ma, takes the infographics out…
Britain From Above – Beautiful Use of Satellite Technology
The BBC has a gorgeous documentary series that started yesterday — Britain from…

Watch the Rise of Gasoline Retail Prices, 1993 – 2008
"What do the data look like for gasoline prices?" The prices go up, then down, then up, down, up...
It’s Like Google Maps with Sim City 2000 – OnionMap
Remember SimCity 2000? That was a great game. That was probably the last…
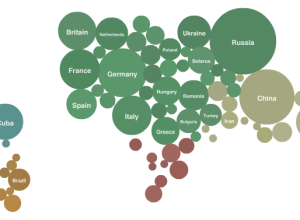
Map of Olympic Medals in Bubble + Geographic Form
Lee Byron, Amanda Cox and Matthew Ericson of the New York Times graphics…
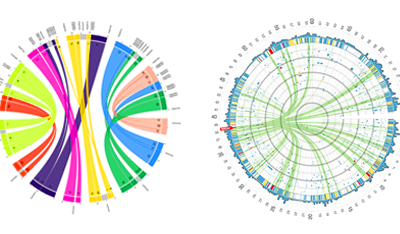
Visualize Genomes and Genomic Data – Circos
Circos is a project by Martin Krzywinski that lets you upload genomic data…
New Version of Flare Visualization Toolkit Released
A new version of Flare, the data visualization toolkit for Actionscript (which means…
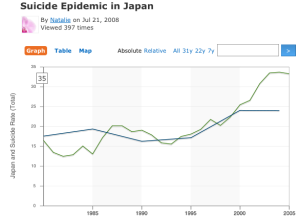
Can You Improve this Graph Showing Suicide Rates in Japan?
Are you ready for another deconstruct/reconstruct exercise? I just posted a time series…
What Kind of Information is Hidden in Barcodes?
Barcodes. We all know what they look like. They’re the black stripes that…
Watching Our Twitter World – twittervision Redux
See what people are tweeting around the world 24/7. What are you doing right now?
There’s More Than One Way to Skin a Dataset
Last week I asked if you could improve a mediocre bar chart showing…