Visualization
Showing the stories in data through statistics, design, aesthetics, and code.
Visualization Workshop in Madrid – Database City
It’s hard to believe that it’s been almost a year since I was…
Beautiful Generative Computer Art – Metamorphosis
Glenn Marshall has released his finished version of Metamorphosis, a beautiful piece of…
maeve Installation Shows Relationships Between Projects
The Interface Design Team at the University of Potsdam revealed maeve last week.…
Art of Mathematics – Visualization of Dynamical Systems
Dynamical systems are mathematical models used to describe the time-dependent position of a…
Tree Map to Show Losses by Major Companies
Taking after Map of the Market, the New York Times uses tree maps…
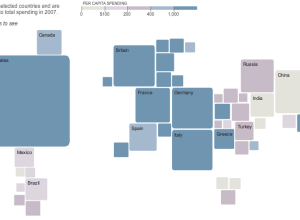
How Consumers Around the World Spend Their Money
This pseudo-map graphic from The New York Times shows how consumers in different…
How Eating Ice Cream and Feeling Gross Leads to Alcholism
This stream of consciousness video (below) from Current is complete with animated infographics…
OneGeology Wants to Be Geological Equivalent of Google Maps
There’s lots of free geographical data about what’s going on at the surface…
See the World Through SimCity’s Eyes – One Up On OnionMap
Michael comments, “Onionmap is nothing when compared to this Chinese site…They’ve practically mapped…
Interactive Graph Visualization System – Skyrails
Skyrails is an interactive graph visualization system that looks a lot like a…
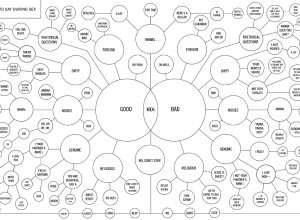
Flowchart Shows You What to Say During Sex
This flowchart shows you what to say during private time with your special…
How to Create a Real-Time Web Traffic Map for Your Site
I just released Visitr. Now you can create a real-time web traffic visualization for your own site or blog.
Tracking Hurricane Gustav – How Hard is it Going to Hit?
Stamen has taken a step towards the concrete with their recent Hurricane Tracker…
How Open Should Open Source Data Visualization Be?
Is releasing my code the best thing to do for myself and the community or is it worth keeping some things private?
Look at My Neato Lollipop Chart – Widgenie
As some commented on an earlier post, FusionCharts provides an easy way for…

Plummeting Infographics from I.O.U.S.A – A Nation in Debt
I haven’t seen I.O.U.S.A. yet, but from the online bonus clips, it looks…
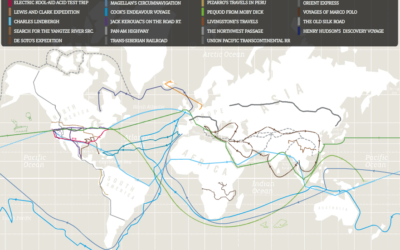
History’s Greatest Journeys – Wanderlust from GOOD
GOOD Magazine, in collaboration with Graham Roberts, maps the most famous journeys in…
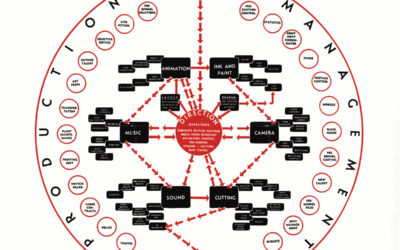
Amusing Disney Org Chart – From Walt on Down
I’m not sure how old this Disney org chart is, but I’m guessing…