Visualization
Showing the stories in data through statistics, design, aesthetics, and code.
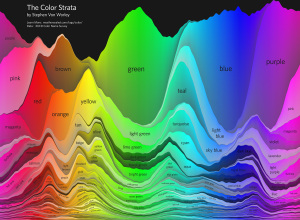
Strata of common and not so common colors
In another look at the data from xkcd’s color experiment, Stephen Von Worley…
Find your booty with Bing treasure maps
Maps on the major sites like Yahoo, Google, and Bing have a similar…
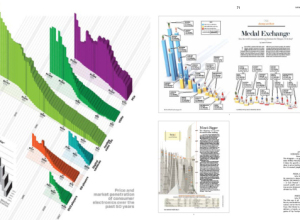
Review: Data Flow 2, Visualizing Information in Graphic Design
Note: The review copy I received is in French. Unfortunately, I only understand…
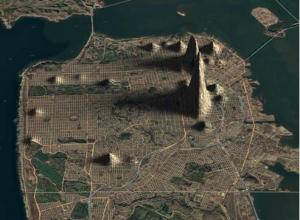
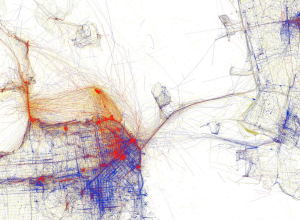
San Francisco crime mapped as elevation
Doug McCune maps San Francisco crime in 2009 as if it were elevation.…
Protovis 3.2 released – more examples and layouts
The most recent version of Protovis, the open-source visualization library that uses JavaScript…
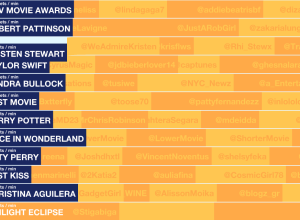
Track the 2010 MTV Movie Awards
Excited about the 2010 MTV Movie Awards? Yeah, me neither. But if you…
How little musicians earn online
You’ve heard about the struggling musician. It’s a tough business. How tough is…
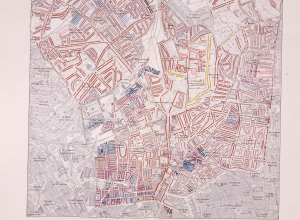
Poverty in late 19th century London
Alice Rawsthorn for The New York Times reports on Charles Booth’s London poverty…
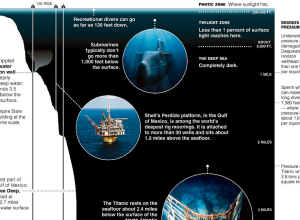
BP oil spill if it were where you live
If it Was My Home is a simple but effective concept. Enter your…
Data Life of the Future
It’s fun to imagine the future. Every few months, someone takes a stab…
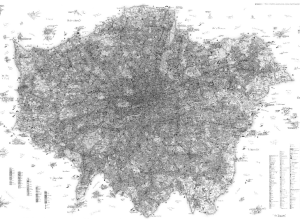
Uber detailed London map satire
Stephen Walter’s The Island looks like an ordinary map of London from afar.…
Charting the radio top 40
BBC Radio 1 takes a shot at displaying the top 40 chart visually…
How our laws are made
It takes a lot of work for a bill to become a law.…
Pulp Fiction timeline
In case you were confused by the Pulp Fiction storyline, dehahs has plotted…
Overhaul of New York subway map
The ever-popular New York subway map is getting some work done, and will…