Visualization
Showing the stories in data through statistics, design, aesthetics, and code.
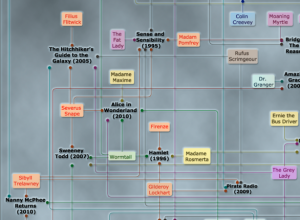
Movies with multiple Harry Potter wizards
I feel like whenever I watch a British film, I see a Harry…
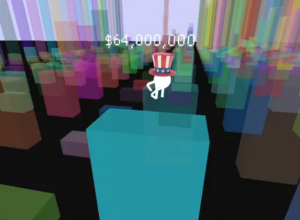
Physically climb over budget data with Kinect
As an entry to the Eyebeam DataVizChallenge to visualize your taxes, Budget Climb…
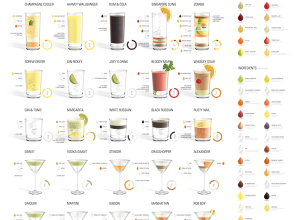
More proportions and cocktails
Designers’ current obsession with cocktails and proportions continues with Konstantin Datz’ recent poster.…

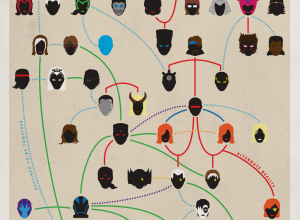
X-Men family tree
Amusing from graphic designer Joe Stone, although not as good as the crazy-detailed…
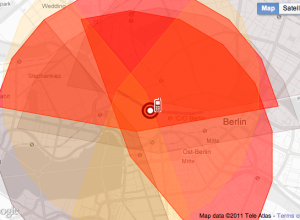
Tell-all telephone reveals politician’s life
Not many people understand the importance of data privacy. They don’t get out…
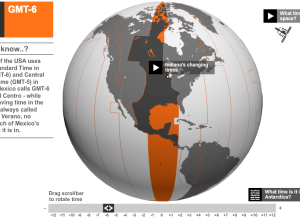
Complexity of time zones explained
Do you understand how time zones work around the world and when exactly…
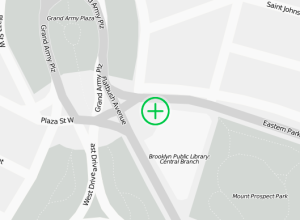
Make your own safety map in case of emergency
It’s a good idea to have a meeting place in case of an…
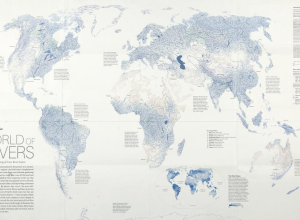
Every river system mapped in World of Rivers
The annual Malofiej awards, for top graphics in journalism, were handed out last…

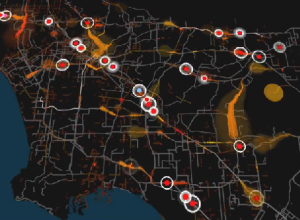
Animation: The pain that is Los Angeles traffic
Los Angeles has a lot of things to do. The trouble is, compared…
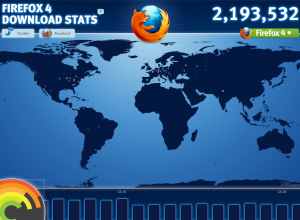
Firefox 4 downloads in real-time
Firefox 4 came out of beta today and is now available for download.…
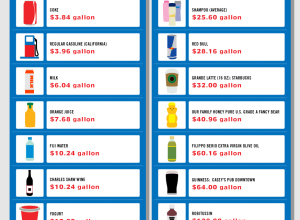
Gallons of stuff that cost more than gasoline
In response to Sarah Palin’s complaints about gas prices around four dollars per…

History of the world in 100 seconds, according to Wikipedia
As you know, the world wasn’t always how you know it today. Land…
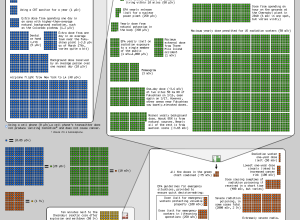
Radiation doses and safety in perspective
Randall Munroe of xkcd, with the help of a friend who is senior…

Japan satellite photos show before and after
The New York Times has a set of sobering satellite photos of Japan.…

Straight lines are surprisingly hard to draw with a mouse
Remember when you played Telephone as a kid? No matter how simple the…