Visualization
Showing the stories in data through statistics, design, aesthetics, and code.
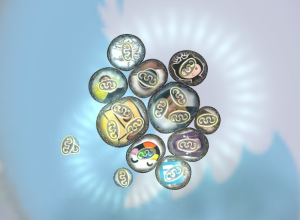
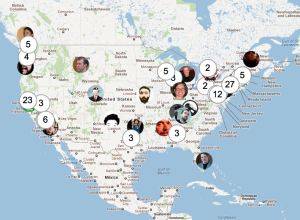
Your personal networks visualized as microbiological cells in Biologic
Data exists in digital form, on our computers and spreadsheets, but the exciting…
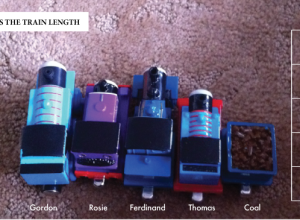
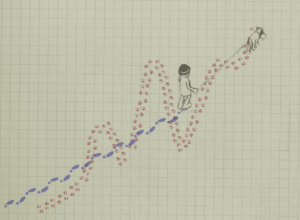
Thomas the Tank Engine and Friends, accidental chart
This came via Twitter from @christopferd:
Will @flowingdata caption my 2 yr old’s…
Data in a human context
Jer Thorp, a data artist in residence at The New York Times, shows…
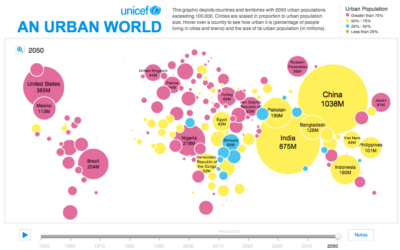
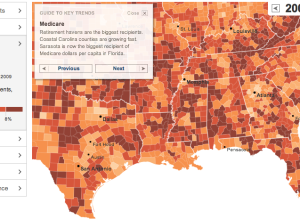
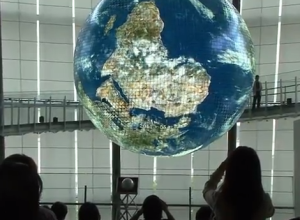
Growing urban populations
In this simple interactive animation by Periscopic, in partnership with UNICEF, we see…
Taxonomy for interactive visual analysis
Interactive visualization continues to grow more useful and prominent in every day analysis.…
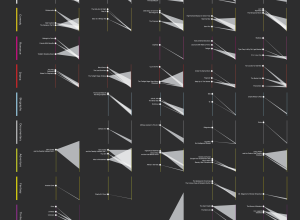
Spotlight on movie profitability
Movies are a curious business. There a variety of forces that encourage people…
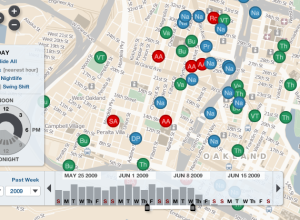
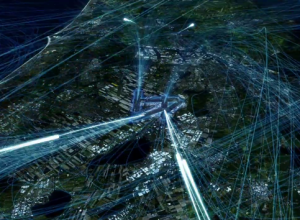
Mobile phone digital traces
In collaboration with Lift and Near Future Laboratory, Interactive Things explores digital traces…
Difference between weather and climate explained
The difference:
In this animated short, the relationship between trend and variation are…
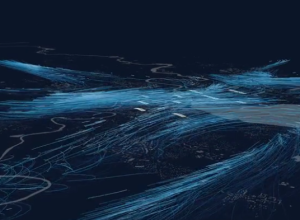
Wind motion patterns animated
Nicolas Garcia Belmonte, author of the JavaScript InfoVis Toolkit, mapped 72 hours of…
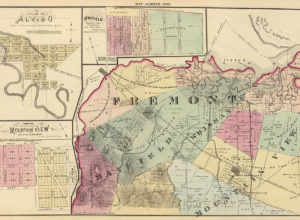
Maps with R →
Three-part tutorial on making non-ugly choropleth maps in R. This is part one.…
Patterns of daily life in Netherlands from Above
In a similar fashion to their work in Britain from Above, CGI and…
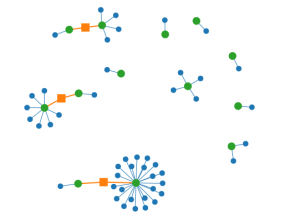
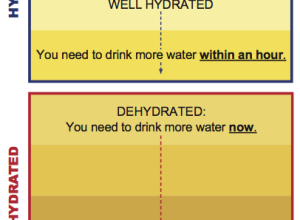
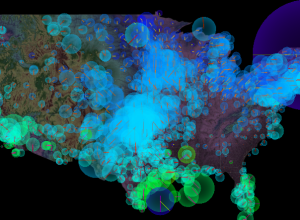
Password reuse visualizer from Mozilla
When you use the same password for every online account, there could be…
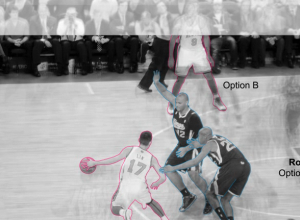
Point guard fundamentals of Jeremy Lin
You knew this was coming, right? The New York Times describes the point…