Tutorials
Visualize your data like an expert with hundreds of practical how-tos for presentation, analysis, and understanding.
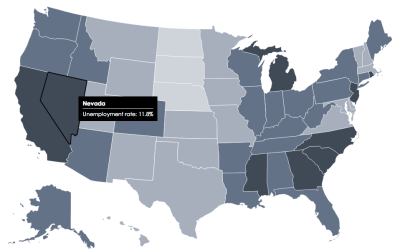
How to Make an Interactive Choropleth Map
When presented with a static graphic, it can be useful to see specific values after you see overall patterns. This tutorial shows you how to add simple interactions to a choropleth map so you can get specifics for regions.
More on Making Heat Maps in R
You saw how to make basic heat maps a while back, but you might want more flexibility for a specific data set. Once you understand the components of a heat map, the rest is straightforward.
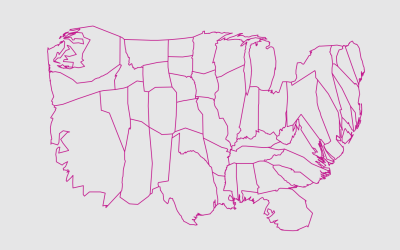
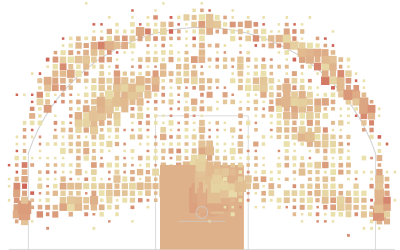
Mapping with Diffusion-based Cartograms
Sometimes these cartograms can distort areas beyond recognition, but they can also provide a better visual representation for a region with a wide range of subregions. At the least, they're fun to look at.
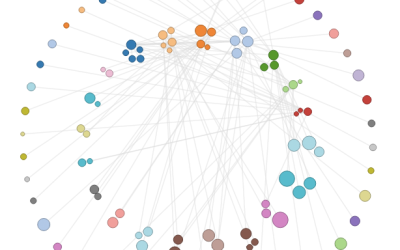
How to Make an Interactive Network Visualization
Interactive network visualizations make it easy to rearrange, filter, and explore your connected data. Learn how to make one using D3 and JavaScript.
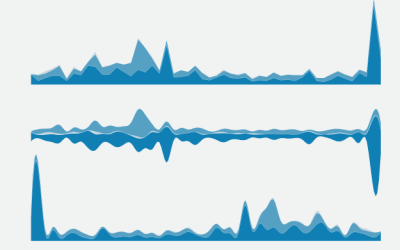
How to Make Stacked Area Charts in R
From the basic area chart, to the stacked version, to the streamgraph, the geometry is similar. Once you know how to do one, you can do them all.
How to Draw in R and Make Custom Plots
When base graphics and existing packages don't do it for you, turn to low-level graphics functions to make what you want.
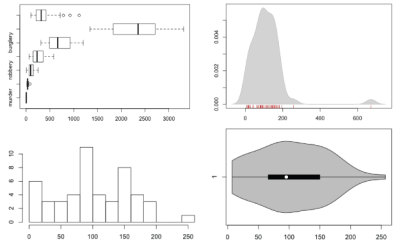
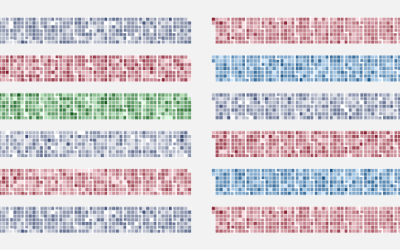
How to Visualize and Compare Distributions in R
Single data points from a large dataset can make it more relatable, but those individual numbers don't mean much without something to compare to. That's where distributions come in.

How to Make a Sankey Diagram to Show Flow
These tend to be made ad hoc and are usually pieced together manually, which takes a lot of time. Here's a way to lay the framework in R, so you don't have to do all the work yourself.
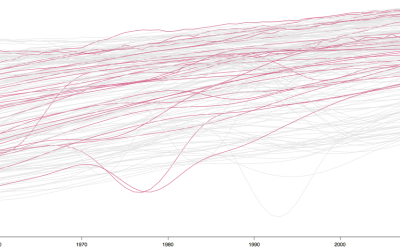
Interactive Time Series Chart with Filters
Time series charts can easily turn to spaghetti when you have multiple categories. By highlighting the ones of interest, you can direct focus and allow comparisons.
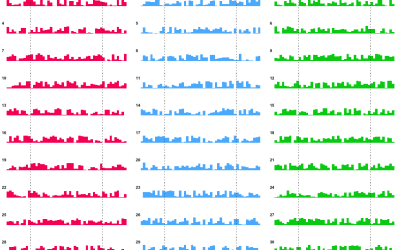
Calendar Heatmaps to Visualize Time Series Data
The familiar but underused layout is a good way to look at patterns over time.
How to Hand Edit R Plots in Inkscape
You can control graph elements with code as you output things from R, but sometimes it is easier to do it manually. Inkscape, an Open Source alternative to Adobe Illustrator, might be what you are looking for.
How to Make a Contour Map
Filled contour plots are useful for looking at density across two dimensions and are often used to visualize geographic data. It's straightforward to make them in R — once you get your data in the right format, that is.
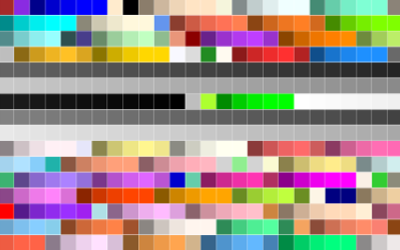
Using Color Scales and Palettes in R
Color can drastically change how a chart reads and what you see in your data, so don't leave it up to chance with defaults.
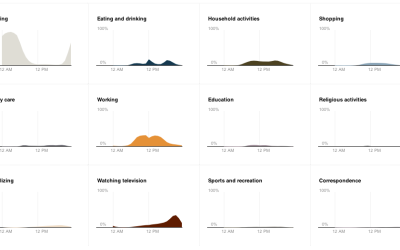
Build Interactive Area Charts with Filters
When you have several time series over many categories, it can be useful to show them separately rather than put it all in one graph. This is one way to do it interactively with categorical filters.
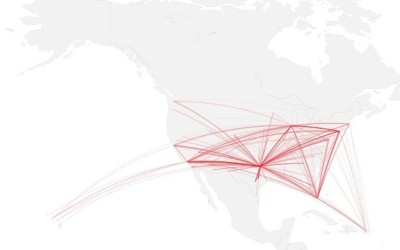
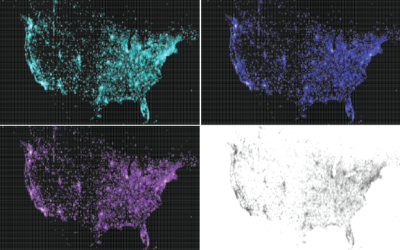
How to map connections with great circles
There are various ways to visualize connections, but one of the most intuitive and straightforward ways is to actually connect entities or objects with lines. And when it comes to geographic connections, great circles are a nice way to do this.
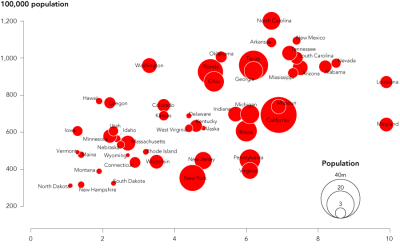
How to Make Bubble Charts
Ever since Hans Rosling presented a motion chart to tell his story of the wealth and health of nations, there has been an affinity for proportional bubbles on an x-y axis. This tutorial is for the static version of the motion chart: the bubble chart.
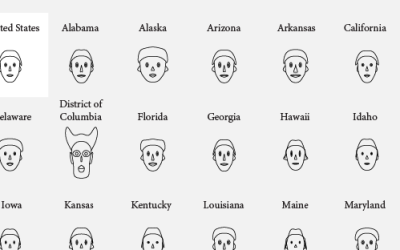
How to visualize data with cartoonish faces ala Chernoff
The goal of Chernoff faces is to show a bunch of variables at once via facial features like lips, eyes, and nose size. Most of the time there are better solutions, but the faces can be interesting to work with.
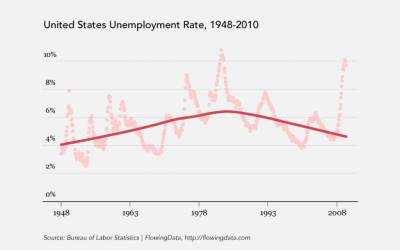
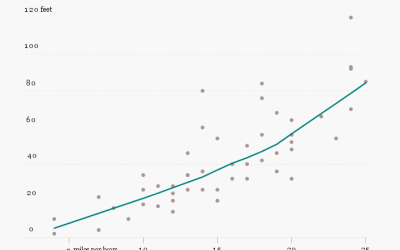
How to: make a scatterplot with a smooth fitted line
Oftentimes, you'll want to fit a line to a bunch of data points. This tutorial will show you how to do that quickly and easily using open-source software, R.