Projects
Graphics by Nathan Yau, borne out of everyday curiosities, learning experiments, and mild insomnia.
Never Been Married
Some people never get married, and some wait longer than others. Let's look at these people.

What I Use to Visualize Data
“What tool should I learn? ” I hesitate to answer, because I use what works best for me, which isn't necessarily the best for someone else or the “best” overall. Nevertheless, here's my toolset.
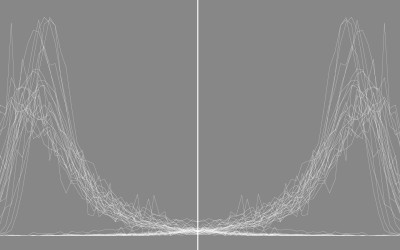
Marrying Age
People get married at various ages, but there are definite trends that vary across demographic groups. What do these trends look like?
Million to One Shot, Doc
Between 2009 and 2014, there were an estimated 17,968 visits to the emergency room for things stuck in a rectum. Here are those things' stories.
Why People Visit the Emergency Room
These are the top 250 products that people injure themselves on or with in a year.

How You Will Die
So far we've seen when you will die and how other people tend to die. Now let's put the two together to see how and when you will die, given your sex, race, and age.
Causes of Death
There are many ways to die. Cancer. Infection. Mental. External. This is how different groups of people died over the past 10 years, visualized by age.
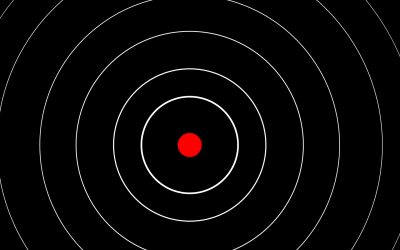
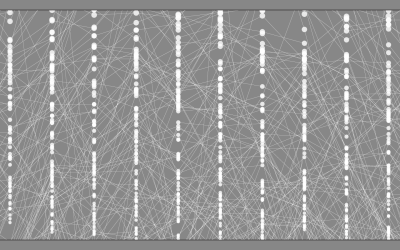
A Day in the Life of Americans
I wanted to see how daily patterns emerge at the individual level and how a person's entire day plays out. So I simulated 1,000 of them.
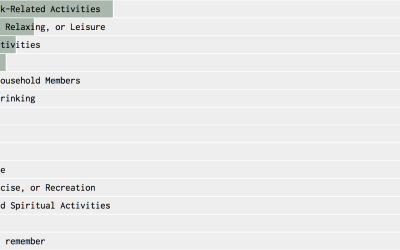
Most Common Use of Time, By Age and Sex (2015)
Typical time use varies by who you talk to. This interactive shows you the differences when you vary age and sex.
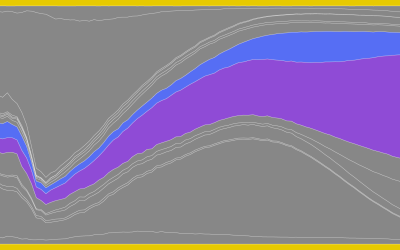
Counting the Hours
Every day is a bit different, but here is a wideout view of how Americans spend their days. Compare with your own time use.
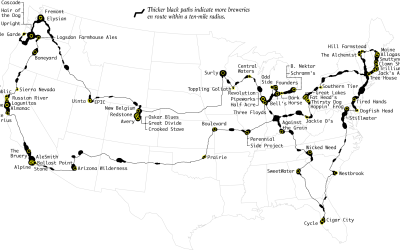
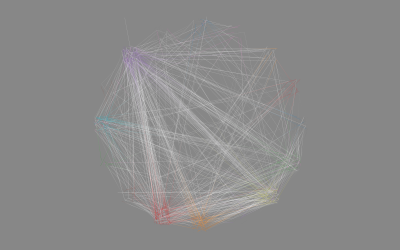
Top Brewery Road Trip, Routed Algorithmically
There are a lot of great craft breweries in the United States, but there is only so much time. This is the computed best way to get to the top rated breweries and how to maximize the beer tasting experience. Every journey begins with a single sip.

Work Counts
Looking at educational attainment, income, work hours, and commute, this is who has the same work life as you do.

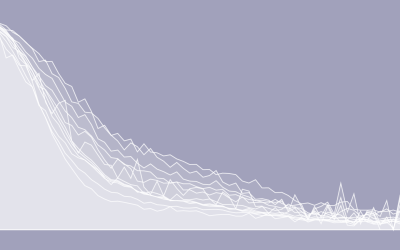
Years You Have Left to Live, Probably
The individual data points of life are much less predictable than the average. Here's a simulation that shows you how much time is left on the clock.
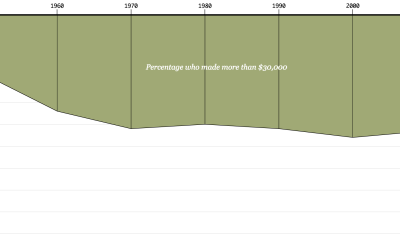
Who Earned a Higher Salary Than You
Work changed over the years. Salaries changed over the years. I was curious: If you compared your personal income from present day, how would it compare to the distribution of salaries in previous decades?