There’s a lot going on today, and of course the news interactive teams…
Infographics
Telling stories with data and graphics.
-
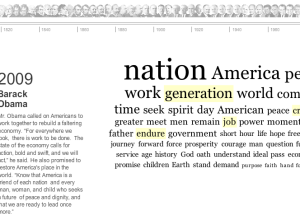
Inaugural Words From 1789 to Present
-
Guide to Inauguration Day
It’s Inauguration Day! There’s a happy buzz in the air, and you can’t…
-

Man vs Woman, Decision-making for Goldstar Beer
These ads for Goldstar beer were hung above bar toilets. They’re comical flow…
-
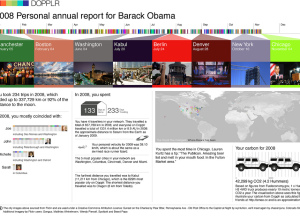
Dopplr Presents Personal Travel Report to All Users
Dopplr is a service that lets you share your travel schedule with friends…
-
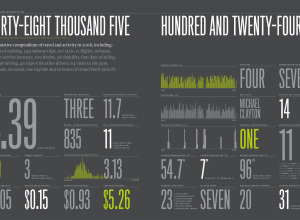
2008 Feltron Annual Report Now Available
After Nicholas Felton’s ever popular 2005, 2006 and 2007 annual report on himself,…
-
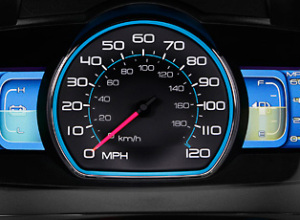
Ford Turns to Design and Data Visualization to Boost Sales
Ford sales are suffering. In an attempt to improve, they’re going green with…
-

Tools You Need to Track Energy Consumption – WattzOn
“Climate change is a global problem. But it’s individuals who will create the…
-
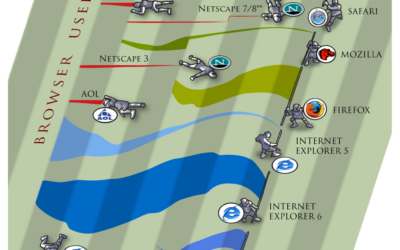
Browser Wars – A New Take on Streamgraphs
Because it’s Friday – PixelLabs puts a cartoon-ish spin on streamgraphs. Who will…
-
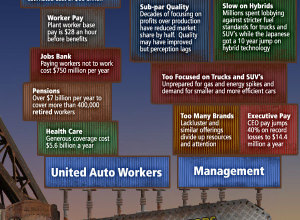
Visual Guide to General Motors’ Financial Woes
As you’ve probably heard, General Motors has come on some financial troubles and…
-
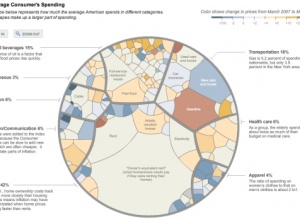
9 Ways to Visualize Consumer Spending
GOOD Magazine’s most recent infographic (above and below) on consumer spending got me…
-
Visual Guide to the Financial Crisis
If you’re like most people, you don’t really know what’s going on with…
-
Exploration of Our Presidents’ First 100 Days in Office
GOOD Magazine and Atley Kasky collaborate to explore U.S. Presidents’ first 100 days…
-
Diagrams Galore in Diagram Diaries Flickr Group
For those watching the clock and waiting for the weekend to hurry up…
-
Sprint Dashboard to the Universe – Plug Into Now
Sprint, in a promotion to their mobile Internet service, created this amusing futuristic…
-
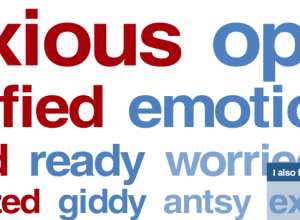
Obama and McCain Voters’ Current State of Mind
The New York Times adds another item to the list of things to…
-
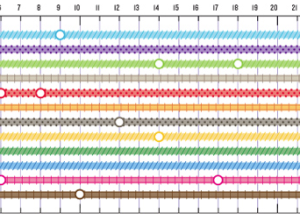
Comparative View of Length of Rivers and Height of Mountains
I had no idea these comparative views of length of rivers and heights…
-

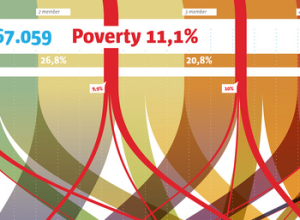
May the Tallest and Fattest Win the Presidency
OPEN N.Y. put together an amusing (and informative) graphic for a New York…
-
Tree Map to Show Losses by Major Companies
Taking after Map of the Market, the New York Times uses tree maps…
Recently for Members
Second Edition
 Visualize This: The FlowingData Guide to Design, Visualization, and Statistics (2nd Edition)
 Visualize This: The FlowingData Guide to Design, Visualization, and Statistics (2nd Edition)
New tools, refined process.
Browse by Chart Type See All →


