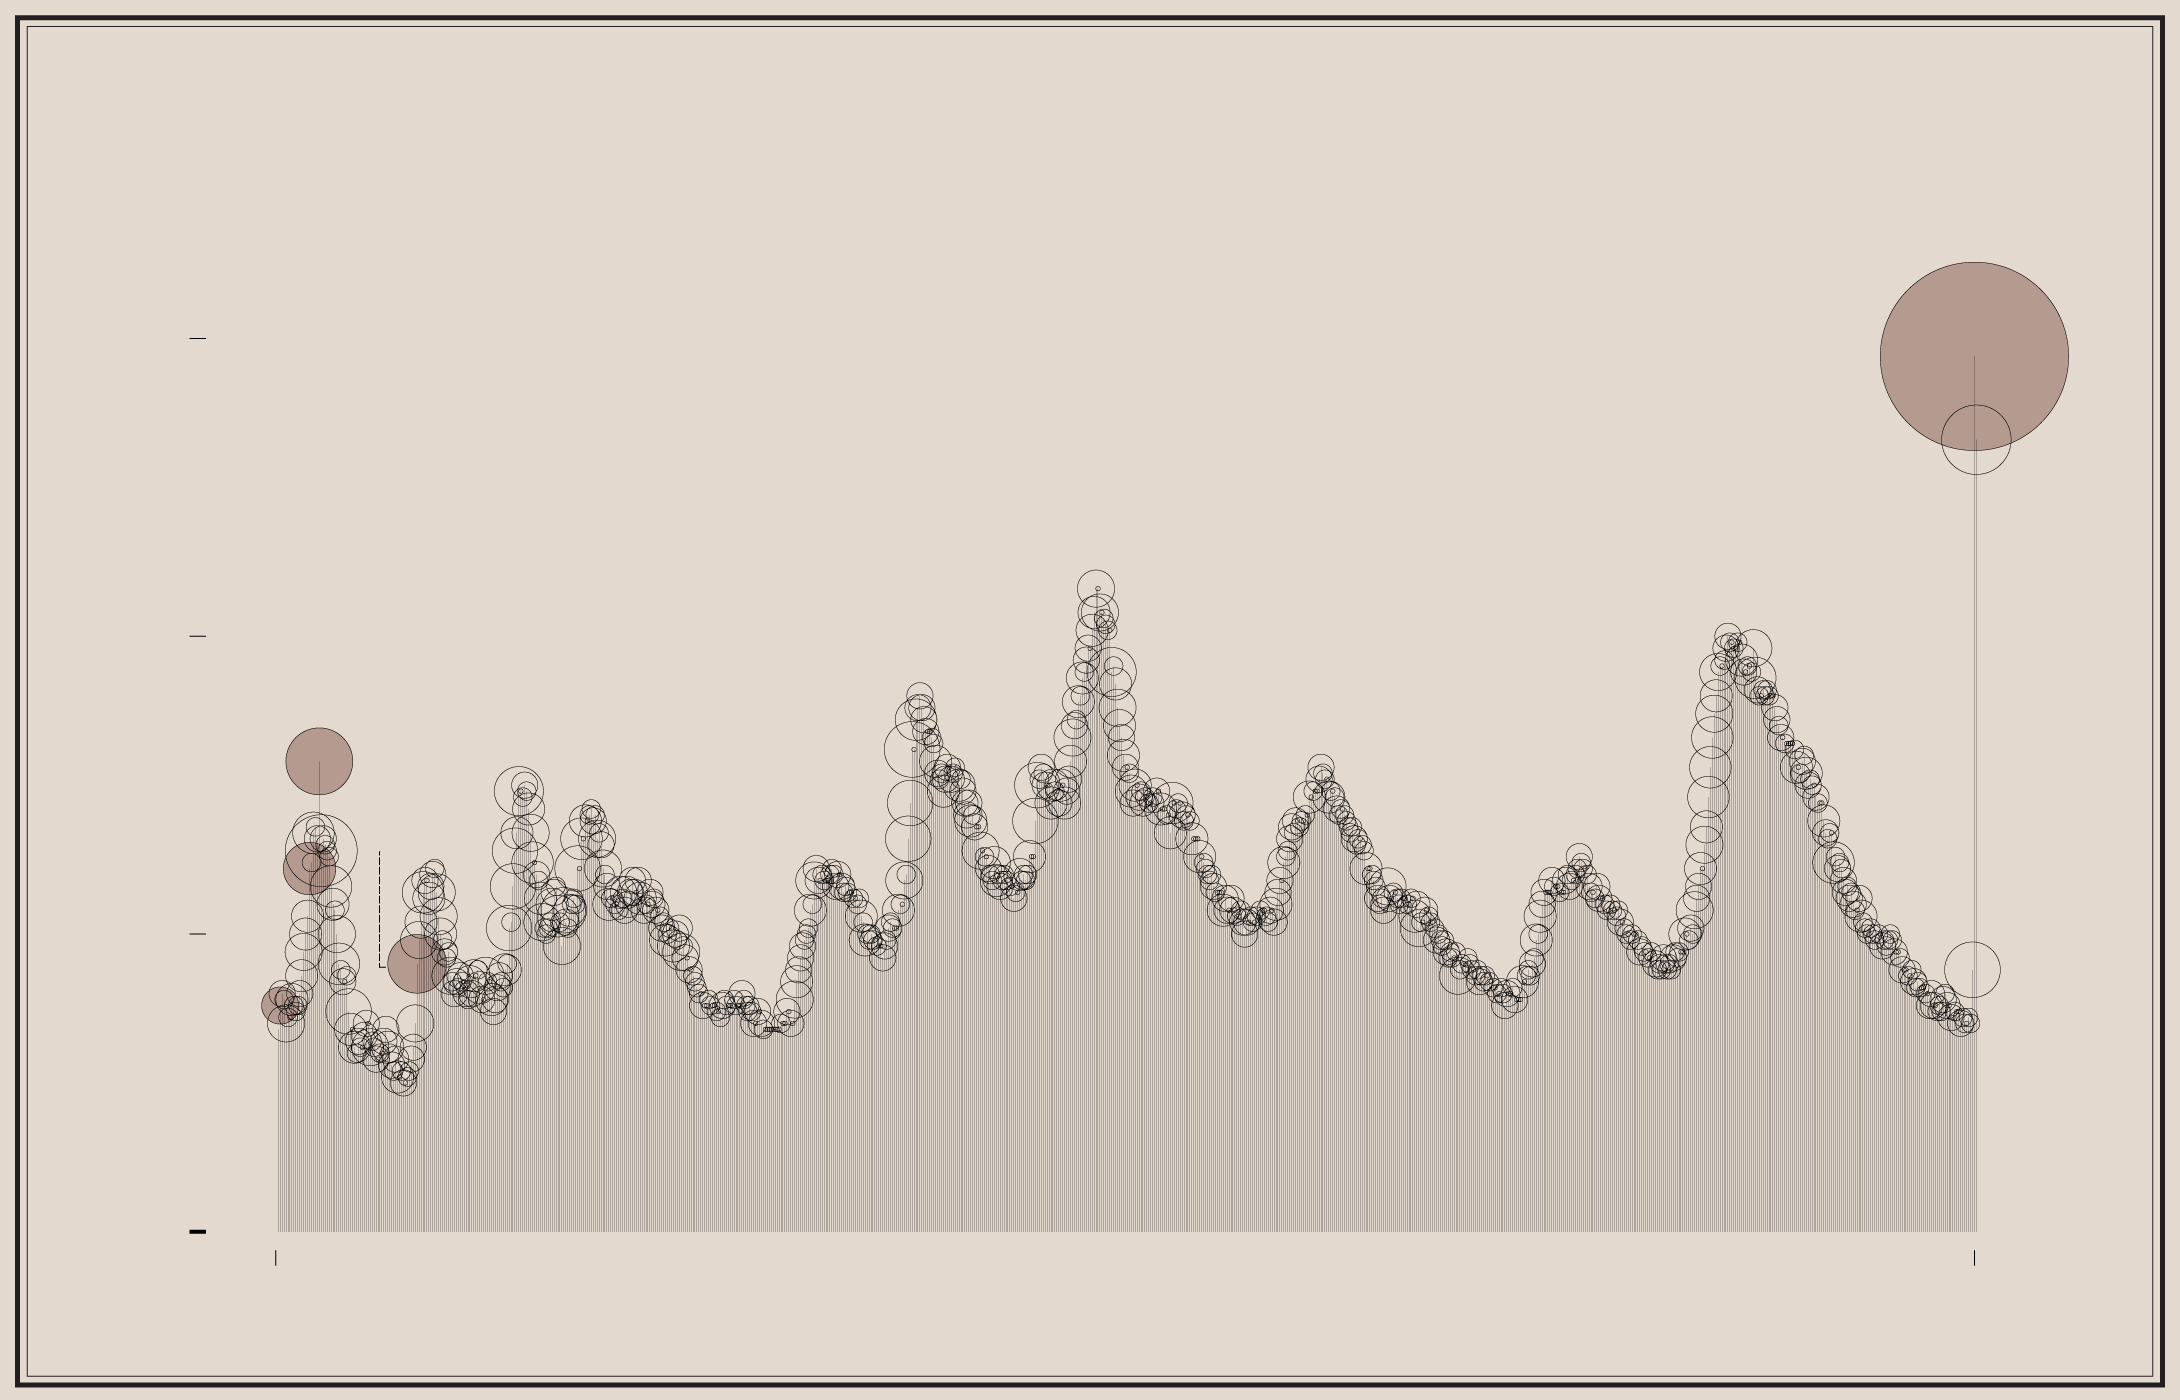
CHART
SHOWING RATE AND MONTHLY CHANGE FROM 1948 TO 2020 OF SEASONALLY ADJUSTED
UNEMPLOYMENT IN THE UNITED STATES
April 2020
+234%
FOR THOSE 16 YEARS AND OVER
Compiled from data as reported by the Bureau of Labor Statistics
15%
EXPLANATION. Each circle represents the absolute percentage change compared to the previous month. Larger circles mean greater change. Shaded circles indicate greatest increase since previous greatest. Circles are placed by time horizontally and by unemployment rate vertically.
10%
Oct. 1949
+20%
Dec. 1953
+29%
May 1949
+15%
5%
Feb. 1948
+12%
0%
January 1948
May 2020
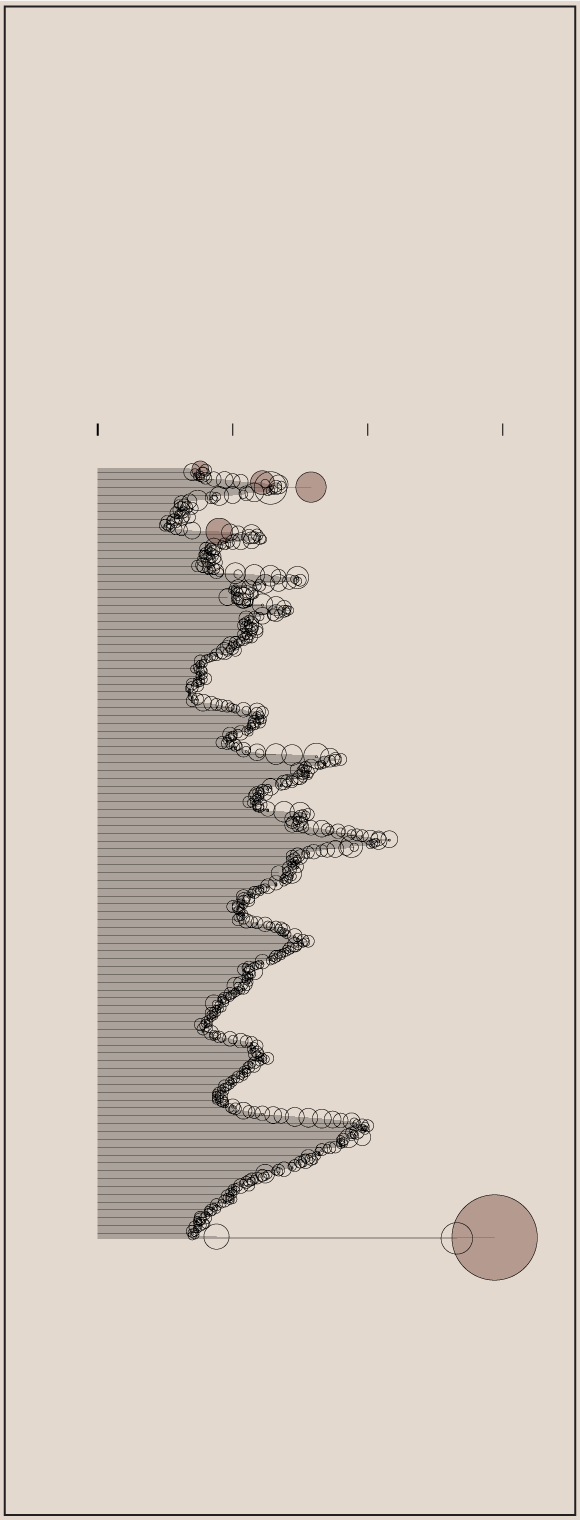
CHART
SHOWING RATE AND MONTHLY CHANGE FROM 1948 TO 2020 OF SEASONALLY ADJUSTED
UNEMPLOYMENT IN THE UNITED STATES
FOR THOSE 16 YEARS AND OVER
Compiled from data as reported by the Bureau of Labor Statistics
0%
5%
10%
15%
Jan.
1948
Feb. 1948
+12%
May 1949
+15%
Oct. 1949
+20%
Dec. 1953
+20%
April 2020
+234%
May
2020
EXPLANATION. Each circle represents the absolute percentage change compared to the previous month. Larger circles mean greater change. Shaded circles indicate greatest increase since previous greatest. Circles are placed by time horizontally and by unemployment rate vertically.
In April 2020, the Bureau of Labor Statistics estimated a national unemployment rate of 14.7%. It wasn’t just the rate itself but how fast it spiked. The month before it was at 4.4%, so as businesses shut down, the rate more than tripled in just a month.
Looking at rates since 1948, for which BLS provides monthly estimates, the biggest single-month jump before the pandemic was during the recession of 1953. In December of that year, the rate increased by 29%.
Become a member. Support an independent site. Get extra visualization goodness.
See What You Get