How Much Time We Spend Alone and With Others
Oftentimes what we’re doing isn’t so important as who we’re spending our time with. The chart below, based on data from the American Time Use Survey, shows a simulated day for 100 people.
Time Spent with Others During a Single Day
A simulation of a weekday. Each dot represents a person.
ATUS asks participants what they did on a given day, along with who they were with during each activity. However, for privacy reasons, ATUS doesn’t ask who you’re with while you were sleeping or doing personal activities like grooming. That’s the “unavailable” category in the chart above. Most of that time is sleeping.
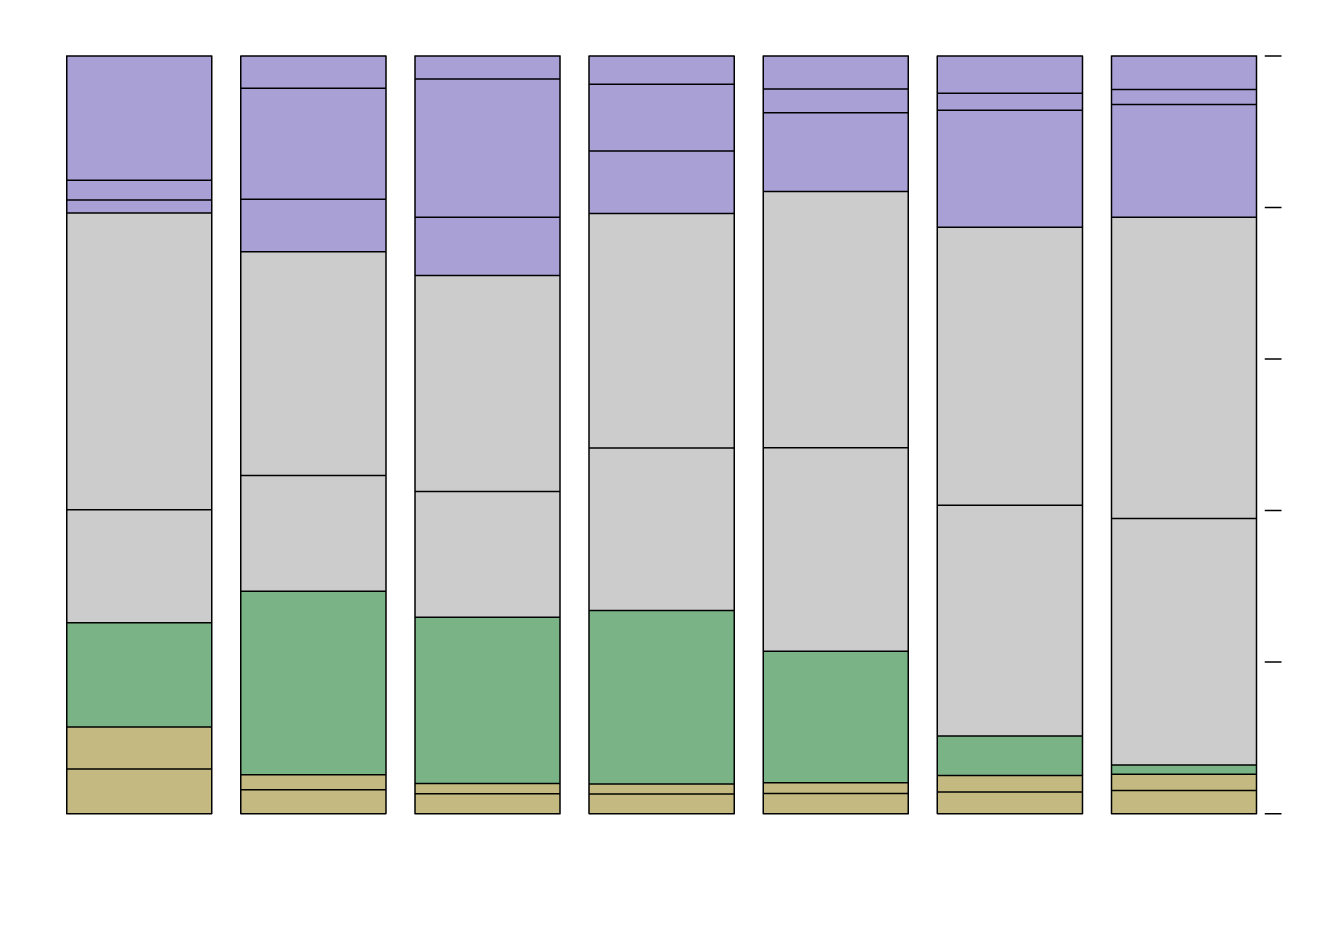
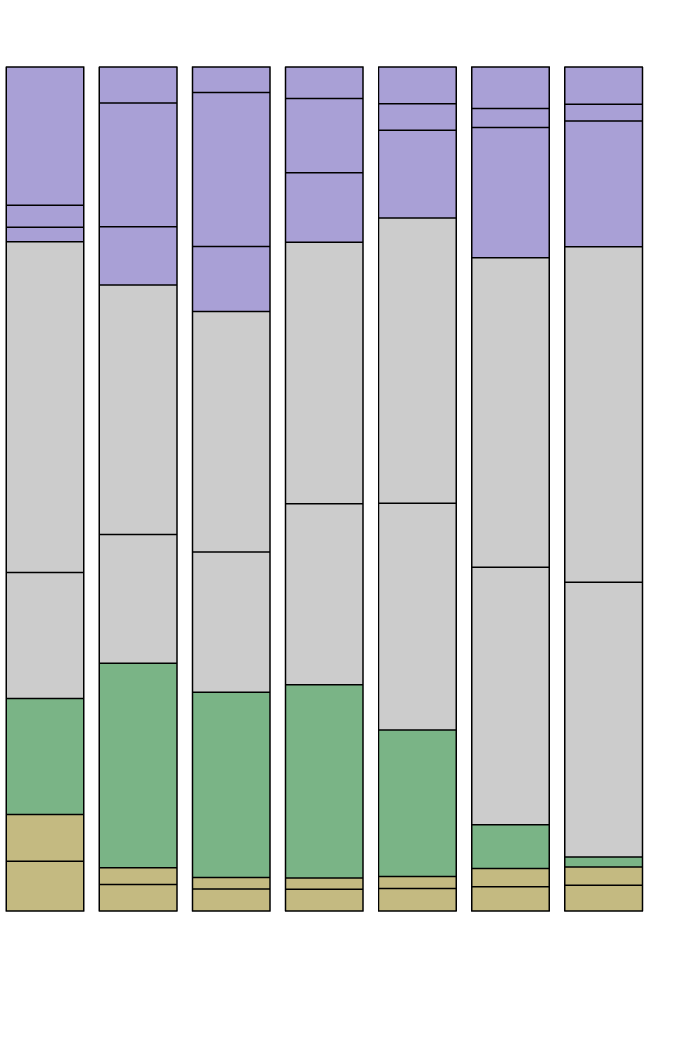
Who we spend time with changes as we get older. We looked at this before, but here’s a maybe more intuitive view. It’s the average percentage of a day we spend with others.
Less Time With Others as We Get Older
Average percentage of a weekday we spend with different people.

PERCENTAGE OF DAY SPENT WITH OTHERS
100%
Family
More time goes to our partner and children during this part of our lives.
In our later years, the kids leave the house, and more time is spent with our partners.
Children
Partner
80%
Unavailable
Sleeping and personal activities don’t include who a person was with.
60%
40%
Alone
There is also more alone time after we retire.
20%
Work
We also get jobs, spending time with co-workers.
Friends
Other
0%
15 TO 24
YEARS OLD
25 TO 34
35 TO 44
45 TO 54
55 TO 64
65 TO 74
75 AND OLDER
Source: American Time Use Survey, 2011–2020 / By: FlowingData

PERCENTAGE OF DAY SPENT WITH OTHERS
100%
More time goes to our partner and children during this part of our lives.
In our later years, the kids leave the house, and more time is spent with our partners.
Family
Children
Partner
80%
Unavailable
Sleeping and personal activities don’t include who a person was with.
60%
40%
Alone
There is also more alone time after we retire.
20%
Work
We also get jobs, spending time with co-workers.
Friends
Other
0%
15–24
YEARS
25–34
35–44
45–54
55–64
65–74
75+
Source: American Time Use Survey, 2011–2020 / By: FlowingData
You see responsibilities stack up in middle age and then die down as we get older. In our later years, we spend more time alone or with our partners.
The estimates are based on American Time Use Survey data from 2011 through 2020. I downloaded the data via IPUMS.
Become a member. Support an independent site. Make great charts.
See What You GetFlowingData is made possible by supporting members. Since 2007, I, Nathan Yau, a real person, have been analyzing and visualizing data to help more people understand and appreciate it in their everyday lives.
If you liked this or want to make similar data things, please consider supporting this small corner of the internet. You get unlimited access to visualization courses, tutorials, and extra resources. Thanks. — Nathan


