Alone Time

It’s harder to make friends as you get older. There aren’t as many (forced) opportunities to find them and we grow pickier with who we spend our time with. So it should make sense that as we get older, we spend more time alone, especially as kids leave the house and friends pass on.
Data from the American Time Use Survey gives us a good idea of the magnitude of change. Better known for the minutes spent doing activities, the survey also asks who those activities were with. Or, in this case, we’re interested in who people were not with.
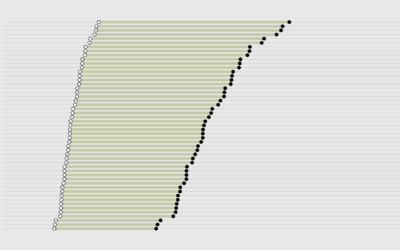
The charts below show the percentage of people who were alone on weekdays and weekends, given the time of day and people’s age.
For privacy reasons, the survey does not record who people were with while sleeping, grooming, or doing personal activities, so the percentages are out of those who were awake. My hunch is that if we were able to see everyone, the alone percentage would be lower, because something like half the 15 and older population is married. And there are also unmarried couples.
Still, as you look at each age group the trends are clearly upwards, younger to older. It’s a steeper increase for females than it is for males. I’m guessing this is related to the common family structure where women stay home to take care of children and men go to work.
 How the Average Working Adult Spends Days
Zoom out to see time spent during all of adulthood.
Notes
- The data comes from five years of the American Time Use Survey, from 2011 to 2015. I downloaded the data from the IPUMS American Time Use Survey Extract Builder.
- I analyzed the data using R and made the charts with d3.js.
- Henrik Lindberg calculated the average time spent with others, by age. Also worth a look.
Chart Type Used

Become a member. Support an independent site. Get extra visualization goodness.
See What You Get