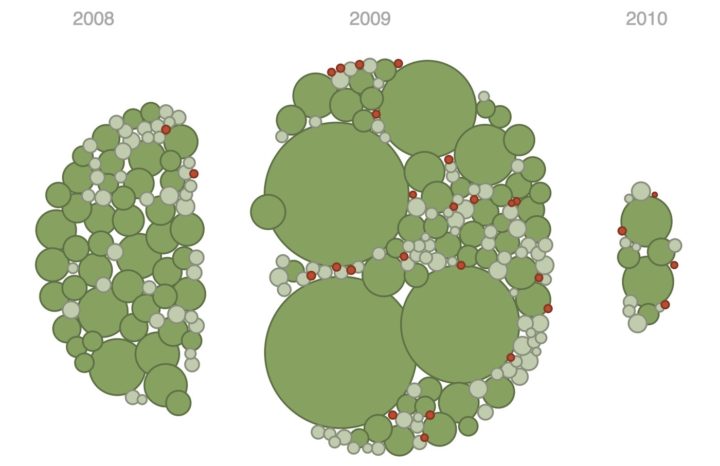
D3.js, or Data-Driven Documents, version 4.0 was released a few months ago, so Jim Vallandingham updated his tutorial for categorized bubble charts to use the new version of the library. I’ve been slow getting to the new d3.js, but maybe this’ll move things along.


