How can we now cope with a large amount of data and still…
Exploratory Data Analysis
Sometimes you don’t know what you’re looking for.
-
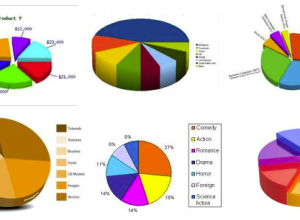
Data Visualization is Only Part of the Answer to Big Data
-

John Tukey and the Beginning of Interactive Graphics
More than 30 years ago, visualization cracked its way into stat.
-
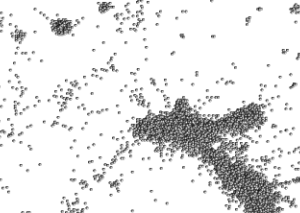
Netflix Prize Dataset Visualization
One million dollars goes to whoever can understand the Netflix ratings dataset best.
-
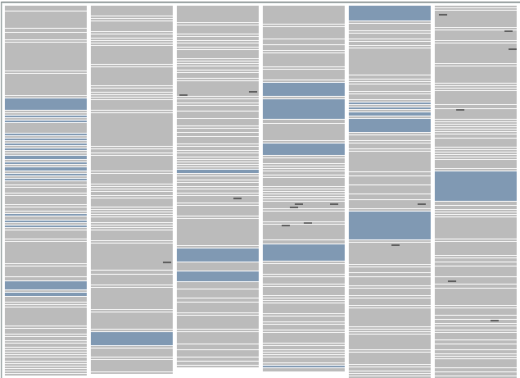
Transcript Analyzer for Republican Debate
The New York Times recently put up a cool data exploration tool to…
-

Exploring Twitter with Blocks
On their new exploration section, Twitter blocks is available for viewing and use.…
Recently for Members
Second Edition
 Visualize This: The FlowingData Guide to Design, Visualization, and Statistics (2nd Edition)
 Visualize This: The FlowingData Guide to Design, Visualization, and Statistics (2nd Edition)
New tools, refined process.
Browse by Chart Type See All →


