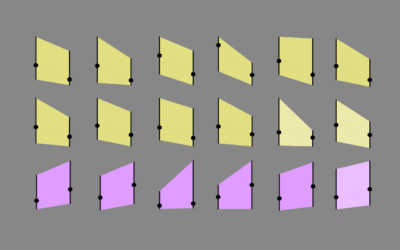
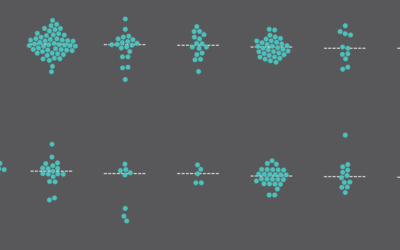
Small Multiples
Use smaller versions of the same chart type to compare across categories.
How Much the Everyday Changes When You Have Kids
I compared time use for those with children under 18 against those without. Here's where the minutes go.
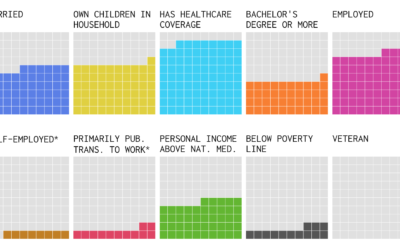
The Demographics of Others
I think we can all benefit from knowing a little more about others these days. This is a glimpse of how different groups live.
Charting all the major California wildfires since 2000
Based on data from CAL FIRE, Erin Ross, for Axios, plotted California wildfires…
Divorce and Occupation, in 2015
Some jobs tend towards higher divorce rates. Some towards lower. Salary also probably plays a role.
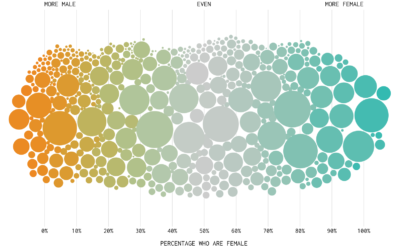
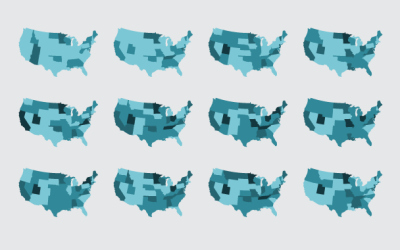
Mapping the Spread of Obesity
A look at the rise for each state over three decades, for men and women.
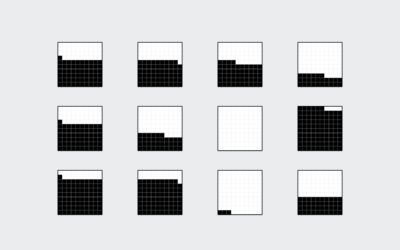
How to Make Square Pie Charts in R
Instead of traditional pie charts that rely on angles and arc lengths to show parts of a whole, try this easier-to-read version.
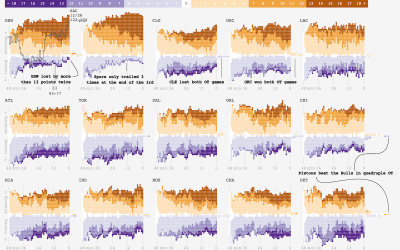
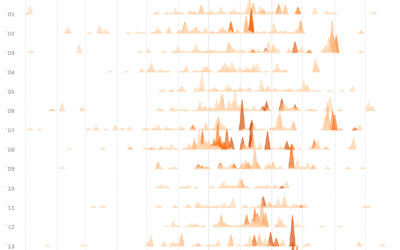
Small multiples for NBA game differentials
Adam Pearce charted minute-by-minute point differentials for NBA games during the 2014-15 season.…
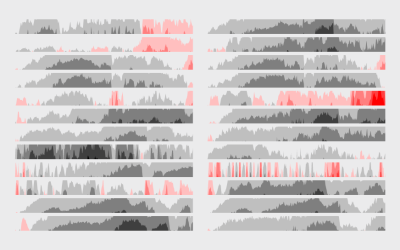
How to Make Horizon Graphs in R
The relatively new and lesser known time series visualization can be useful if you know what you're looking at, and they take up a lot less space.
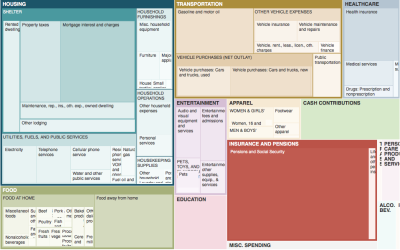
How We Spend Our Money, a Breakdown
We know spending changes when you have more money. Here's by how much.
How to Make Interactive Linked Small Multiples
Small multiples are great, and the right interactions can make them even better. A primer and a how-to.
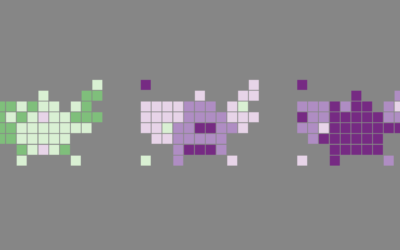
Small Maps and Grids
Maybe you want to make spatial comparisons over time or across categories. Organized small maps might do the trick.

Small Multiples in R
Make a lot of charts at once, line them up in a grid, and you can make quick comparisons across several categories.