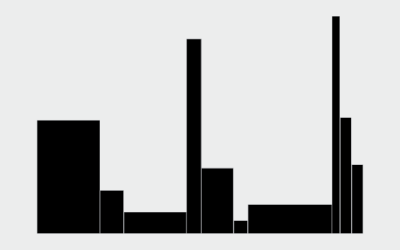
Bar Chart
The old standby. The classic. The bar height or length represents data. The baseline starts at zero.


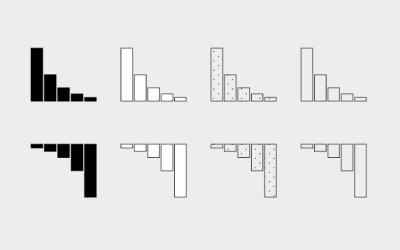
How to Visualize Proportions in R
There are many ways to show parts of a whole. Here are quick one-liners for the more common ones.
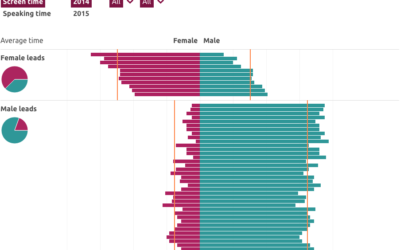
Computed screen time for men and women
In a collaborative effort, the Geena Davis Institute on Gender in Media computed…
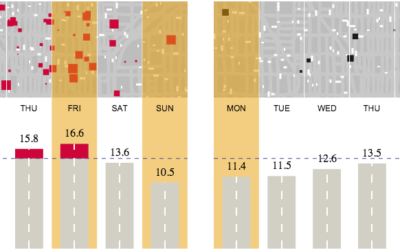
How Much Alcohol Americans Drink, in 2014
Most people have one or two drinks on average, but some consume much more.

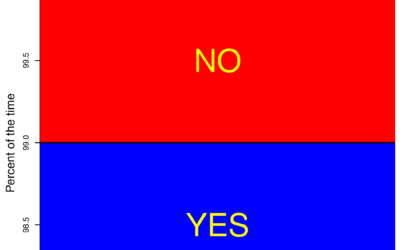
Who Still Smokes?
Two decades out from the first statewide ban on smoking in enclosed workplaces, here's who still smokes.

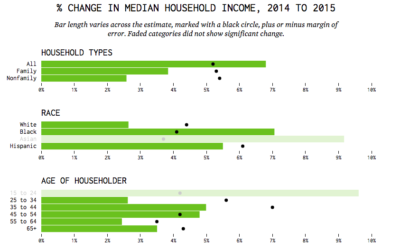
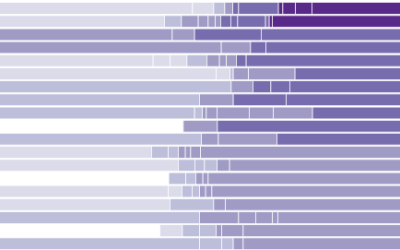
How You Will Die
So far we've seen when you will die and how other people tend to die. Now let's put the two together to see how and when you will die, given your sex, race, and age.
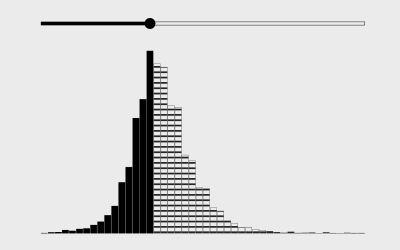
How to Make an Interactive Bar Chart With a Slider
Provide a slider for the standard bar chart so that users can shift focus to a point of interest.
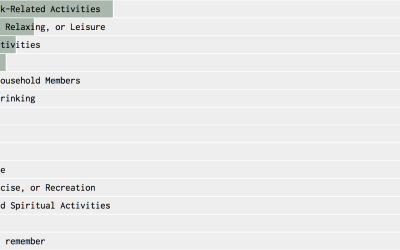
Most Common Use of Time, By Age and Sex (2015)
Typical time use varies by who you talk to. This interactive shows you the differences when you vary age and sex.

Bar Chart Baselines Start at Zero
There are visualization rules and there are visualization suggestions. Most are suggestions. The ones that are rules exist because of how our brains process visual information. There's just no getting around it.
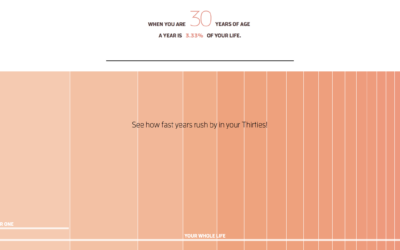
Why time flies when you’re older
When you’re a kid, a year seems like forever. Appending “and a half”…
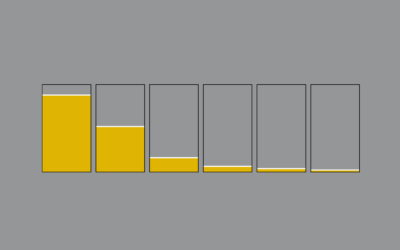
How to Make Variable Width Bar Charts in R
The code to create these bar chart variations is almost the same as if you were to make a standard bar chart. But make sure you get the math right.

Reviving the Statistical Atlas of the United States with New Data
Due to budget cuts, there is no plan for an updated atlas. So I recreated the original 1870 Atlas using today's publicly available data.
State Income Tax Brackets Charted
I’m sure you finished your taxes months ago, but here’s a chart of…
How to Make and Use Bar Charts in R
The chart type seems simple enough, but there sure are a lot of bad ones out there. Get yourself out of default mode.
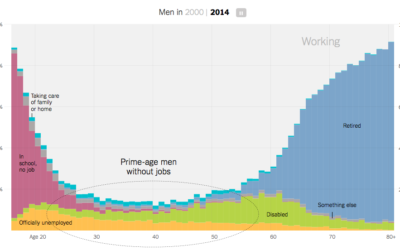
Increasing rates of men who don’t work
Recent data from the Census Bureau suggests the rate of non-working men has…

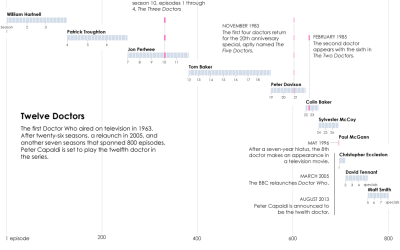
Doctor timeline for Doctor Who
I have yet to see a full episode of Doctor Who, “the longest-running…