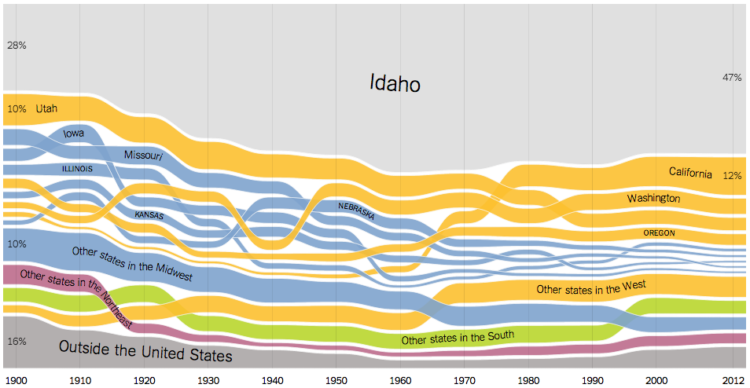
We’ve seen migration within the United States before, but Gregor Aisch, Robert Gebeloff, and Kevin Quealy for the Upshot take a more time-centric look at how people moved state to state, over the past century.
The following charts document domestic migration since the turn of the last century, based on census data. For every state, we’ve broken down the population by resident’s state of birth. The ribbons are color-coded by region, and foreign-born residents are included at the bottom, in gray, to complete the picture for each state.
The good thing about the ribbon approach, other than the flow-like aesthetic that lends well to the topic, is that you can see the change in order through the years. Unlike a stacked area chart, each layer isn’t restricted to an original ranking, so you can for instance, see that a lot of people born in California moved to Idaho starting in the 1960s.
On top of that, there are lots of nice details like ribbons move to the top when you mouse over, labels that follow the time series pattern, and a thicker highlight bar at each point in time. All of these make the data easier to read.


 Visualize This: The FlowingData Guide to Design, Visualization, and Statistics (2nd Edition)
