Visualization
Showing the stories in data through statistics, design, aesthetics, and code.
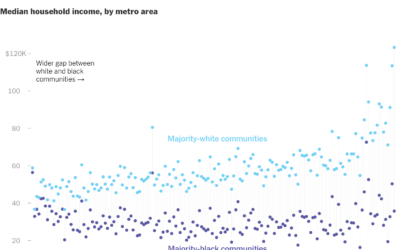
Gaps between black and white America
New York Times Opinion compared several demographics, such as unemployment and income, between…
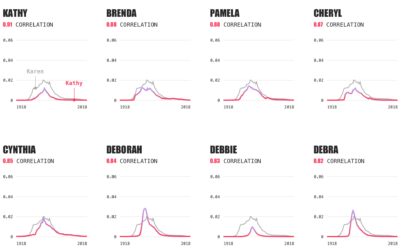
Karen equivalents, based on name data
The name Karen. It’s not a common baby name these days. It peaked…
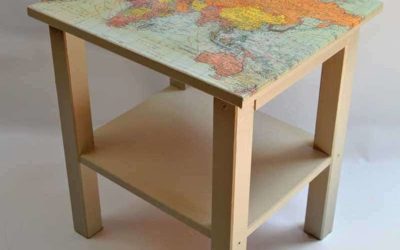
Making a map table using IKEA furniture
All you need is an old table, gift wrapping paper, and some varnish.…

Data visualization wallpaper
As a 100-day project, Alli Torban has been imagining what a data visualization…
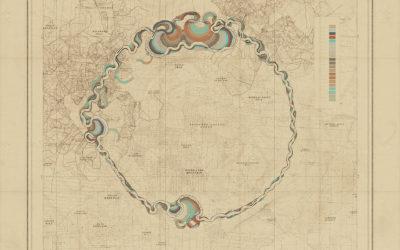
Meandering procedural river maps
Robert Hodgin built a procedural system he calls Meander to generate the beauty…
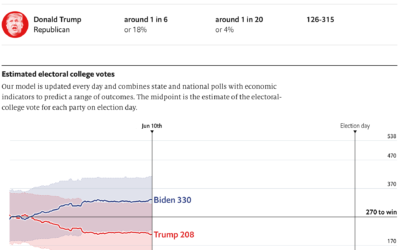
2020 election forecast
The Economist launched their 2020 elections forecast. Right now a part of my…
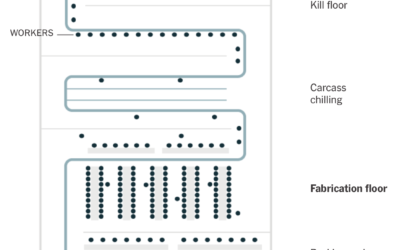
Challenges of reopening the meatpacking plant
To reopen safely, meatpacking plants have to take precautions to provide space and…
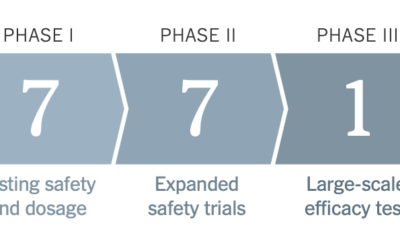
Health conditions and income
A large proportion of those who died from Covid-19 had pre-existing medical conditions.…
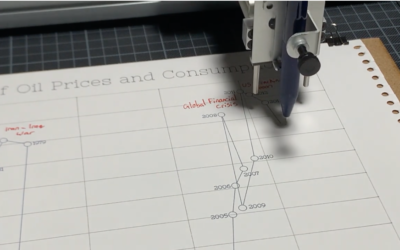
Pen plotter used as storytelling device
Pen plotters slowly draw out a picture line-by-line, so when you watch a…
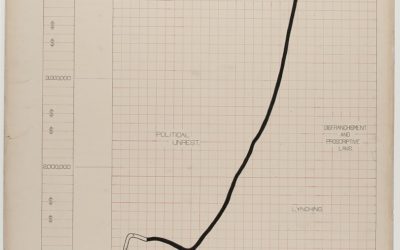
Visualizing black America in 1900
The visualization work of W.E.B. Du Bois and his students has been on…
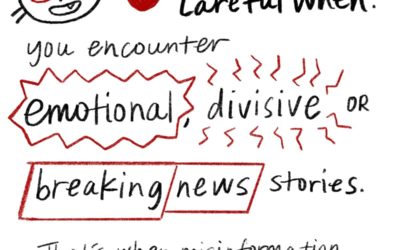
A comic on spotting misinformation
There’s a lot of misinformation passing through the internets right now. A lot.…
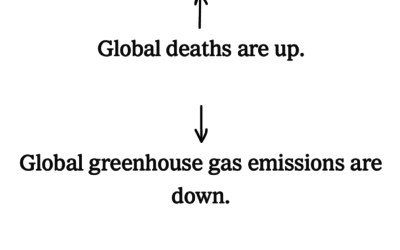
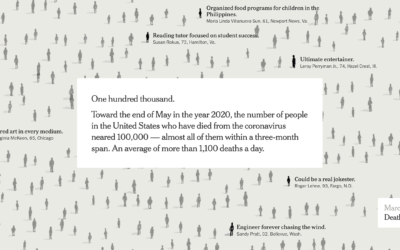
54 ways coronavirus changed the world
The coronavirus has changed everything. Larry Buchanan, for The New York Times, goes…
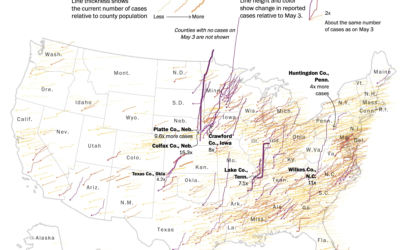
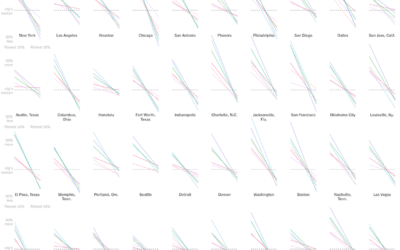
Map shows increasing confirmed cases in rural areas
This map by Tim Meko for The Washington Post uses time series lines…
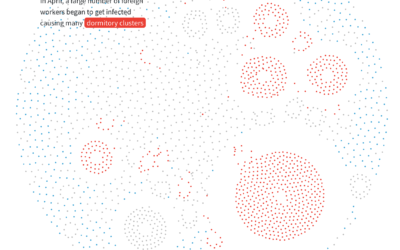
Anatomy of an outbreak
For Reuters, Manas Sharma and Simon Scarr animated a coronavirus outbreak in Singapore…

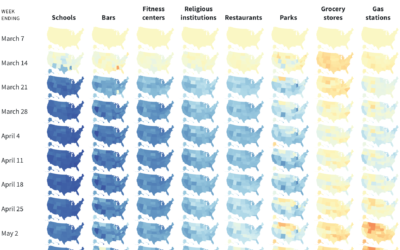
Moves towards reopening the country
Using anonymized cellphone data from SafeGraph, Reade Levinson and Chris Canipe for Reuters…