Visualization
Showing the stories in data through statistics, design, aesthetics, and code.
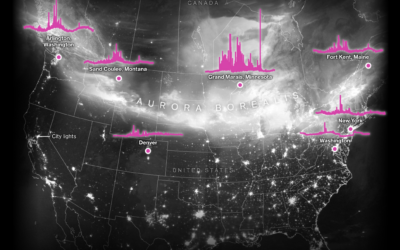
Energy surges due to solar storm
The recent solar storms brought pretty lights to the night sky in some…
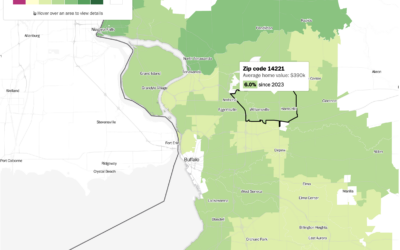
Change in housing prices where you live
I don’t know about you, but where I live, the housing prices keep…

Visualization of flying into a black hole
Assuming you were still alive flying into a black hole, NASA’s Goddard Space…
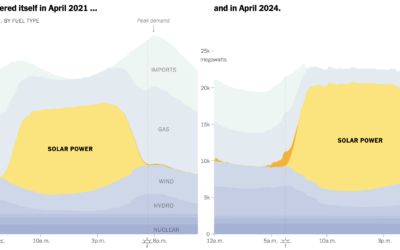
Shifting to batteries for electricity
To capture solar energy for use in the evening, batteries have grown in…

Map of magnetic fields in the Milky Way
Based on data from NASA’s Stratospheric Observatory For Infrared Astronomy (SOFIA), Villanova University…
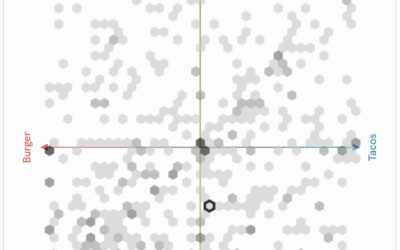
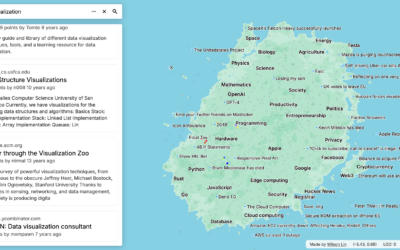
Communal Plot, a shared coordinate space to see how your taste compares
PerThirtySix made a communal plot that asks for your opinion via scatterplot and…
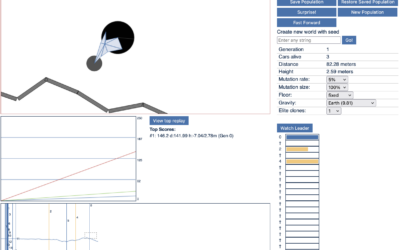
Genetic algorithm car race thingy
From the oldie-but-goodie department, this fun program uses a genetic algorithm to drive…
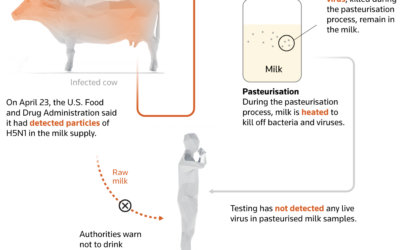
Low risk for human bird flu transmission
For Reuters, Mariano Zafra, Anurag Rao, and Jon McClure describe how bird flu…
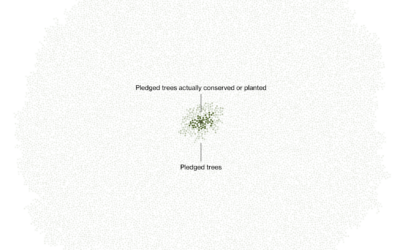
Limited progress towards a plan for planting 1 trillion trees
Marc Benioff, the CEO of Salesforce, set out to plant and conserve 1…
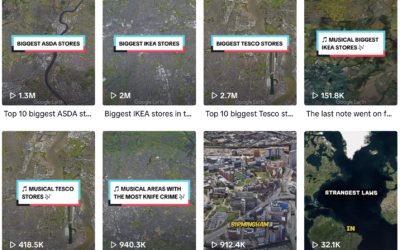
Welcome to the future of data reporting, in musical format
The TikTok account Globetrots combines Google Earth and text-to-speech to show top-ten lists…
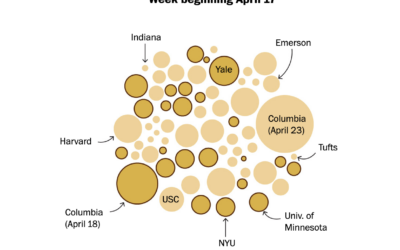
Counts for pro-Palestinian college protests increasing
Based on estimates from the Crowd Counting Consortium, the Washington Post shows the…
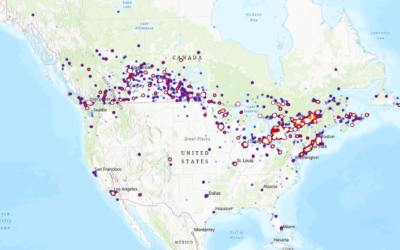
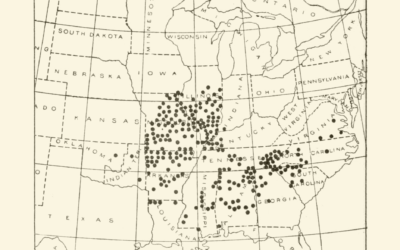
Map of NHL player birth places
Reddit user ChangsManagement mapped where NHL hockey players were born, based on data…
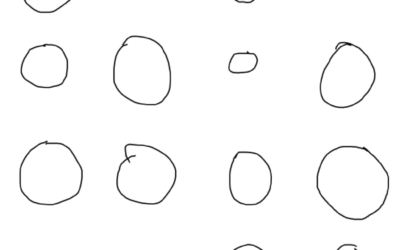
Flipbook drawn by strangers on the internet
The Pudding ran an experiment that asked people to trace a shape. They…

Plastics banned in Hong Kong in an effort to reduce waste, scale
Hong Kong banned single-use plastics often used for food takeaway containers. For South…