Visualization
Showing the stories in data through statistics, design, aesthetics, and code.
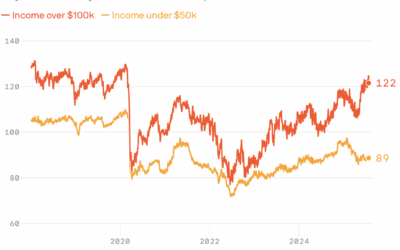
Diverging consumer sentiment
From Axios, a quick chart that shows consumer sentiment between those with annual…
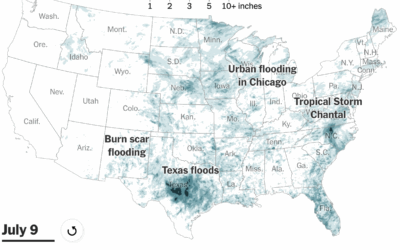
Maps for why all the flash floods
It is “flash flood month” in the United States, brought on by high…
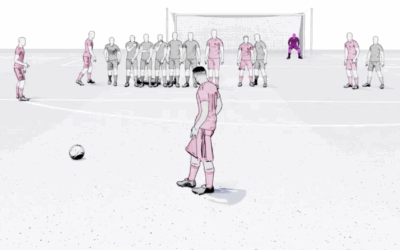
Free kick strategy by Lionel Messi and Cristiano Ronaldo
In soccer, a free kick can be awarded after an opponent commits a…
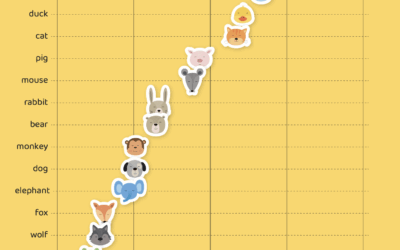
Gender of animal characters in children’s books
Read enough children’s books with anthropomorphic animals and you might notice that some…
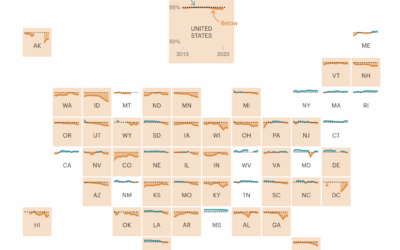
Falling below herd immunity
Vaccination rates are still relatively high, but they need to be for herd…
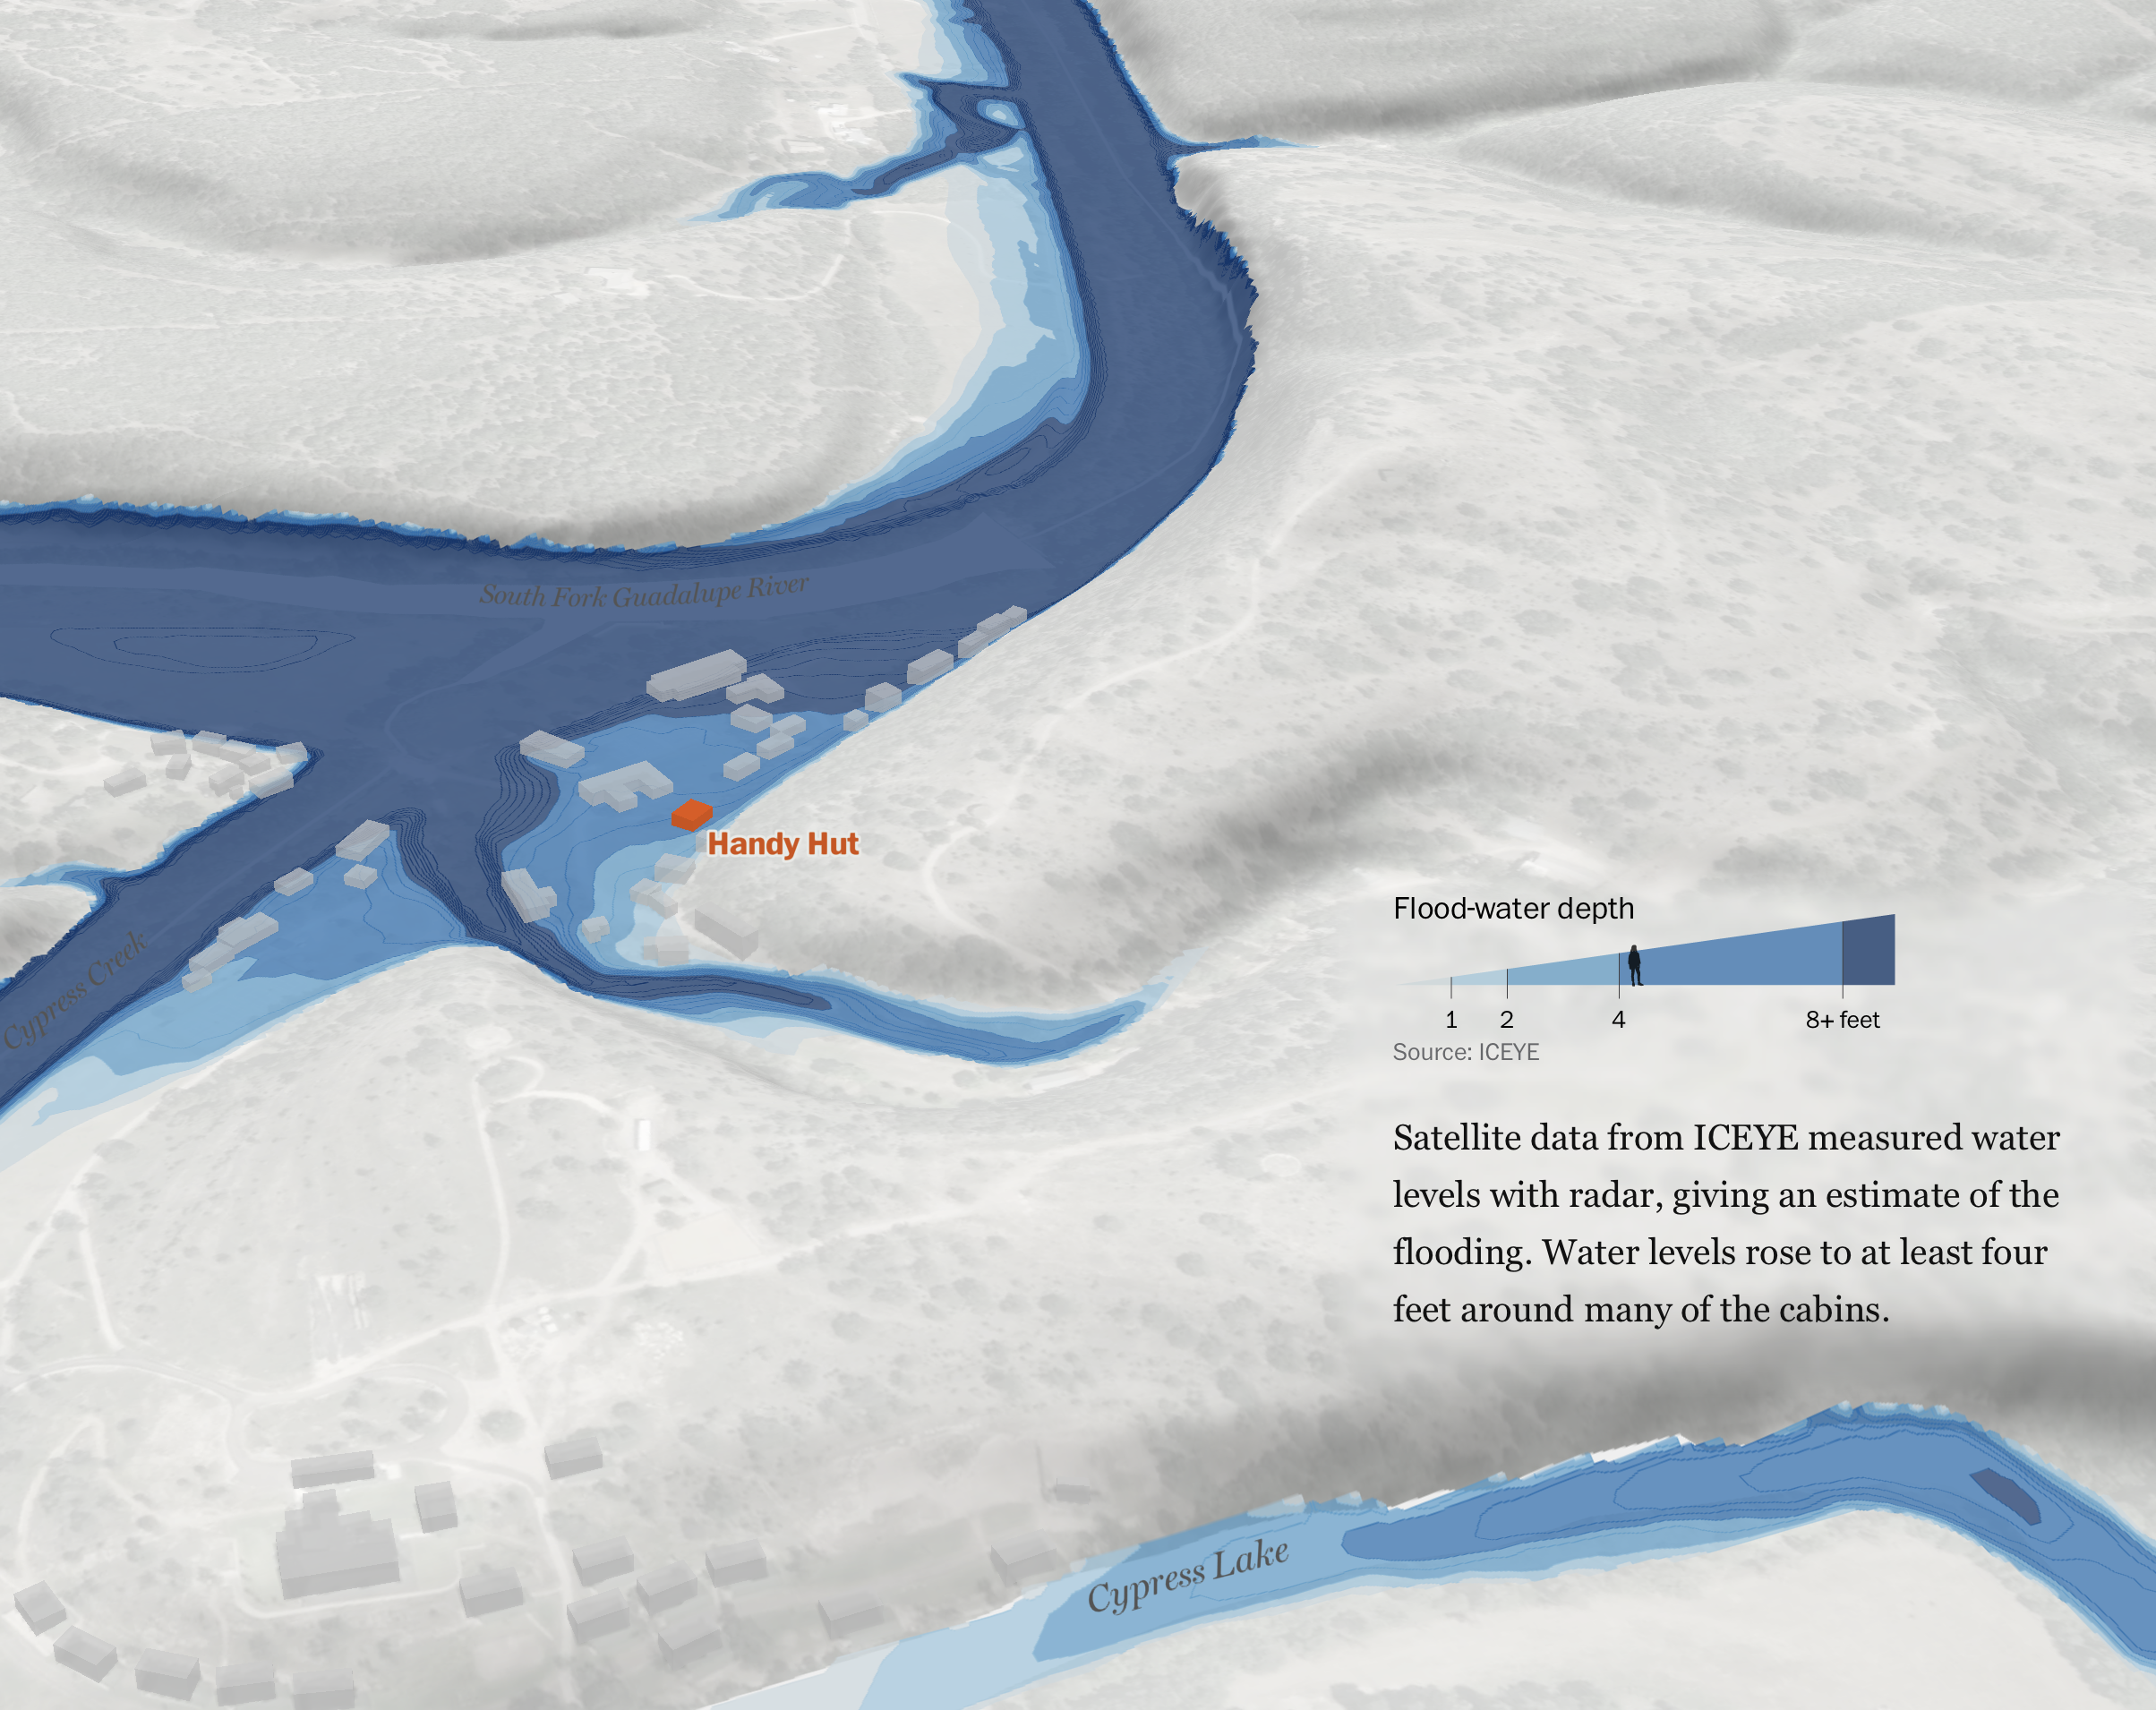
What happened at Camp Mystic
The Washington Post reconstructed the flooding at Camp Mystic, from the perspectives of…
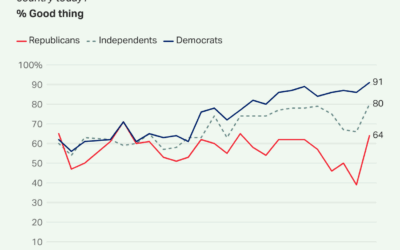
On immigration, more Americans say it’s a good thing
In a Gallup poll run last month, sentiment towards immigration spiked towards positive,…
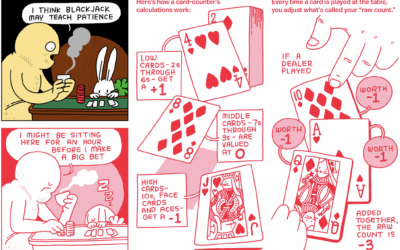
Illustrated guide to card counting and investing
The internet continues to feed my compulsion to click on anything that mentions…
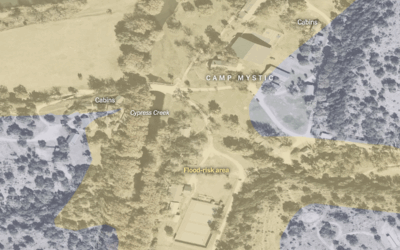
Map of flood-risk area at Camp Mystic
The New York Times mapped an overhead view of Camp Mystic with flood-risk…
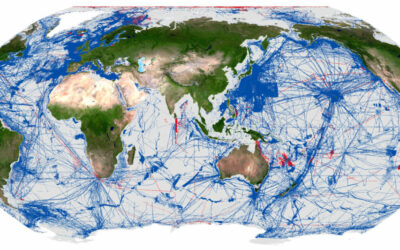
Quarter of the world’s ocean floor has been mapped, so far
The Seabed 2030 Project aims to create a complete map of the world’s…

Studying the why behind the everyday, like coffee stains
Quanta Magazine interviewed physicist Sidney Nagel, who is known for his research in…
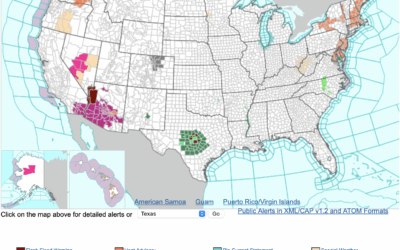
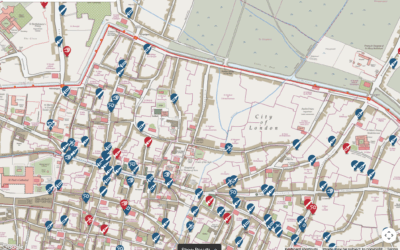
Map of alerts from the National Weather Service
We are seeing in real-time why the National Weather Service, a part of…
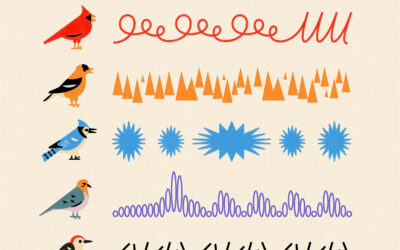
Backyard bird sounds
Alex Tomlinson illustrated backyard sounds of a cardinal, goldfinch, blue jay, mourning dove,…
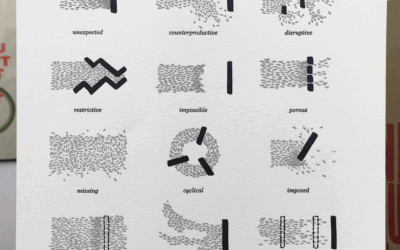
Types of deadlines illustrated from beginning to end
Some deadlines come unexpected, some come staggered, and some come on a fixed…
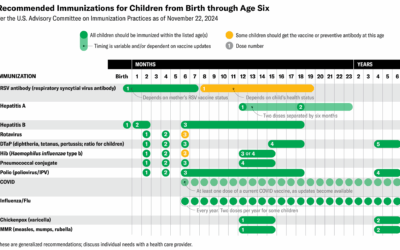
Table for science-backed vaccine recommendations
Jen Christiansen and Meghan Bartels provide a quick reference for Scientific American:
Kennedy’s…