Visualization
Showing the stories in data through statistics, design, aesthetics, and code.
Icons of the Web scaled by popularity
Nmap visualizes site popularity as scaled icons. Favicons, that is. They’re that little…
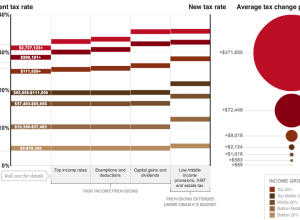
How tax breaks could affect your bottom line
Wilson Andrews and Alicia Parlapiano report for The Washington Post on how the…
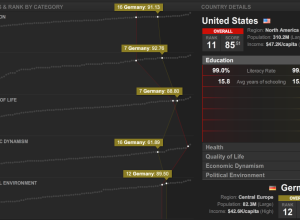
Countries of the world ranked by stuff
What country has the best education? Health? Quality of life? Thomas Klepl and…
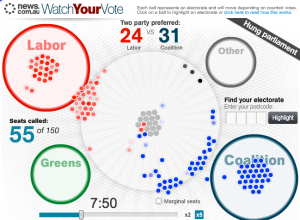
Election night in Australia relived
It was election night a few days ago in Australia, and News.com.au ran…
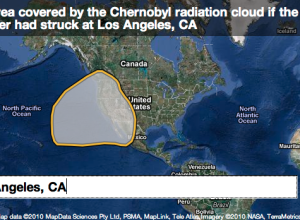
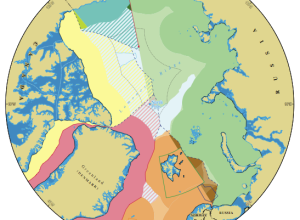
If major environmental disasters happened in your neighborhood…
When major environmental disasters occur, thousands of people are often affected, but it’s…
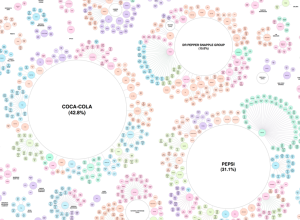
Pseudo-variety and ownership of the soft drink industry
When you buy soft drinks and other beverages at the grocery store, most…
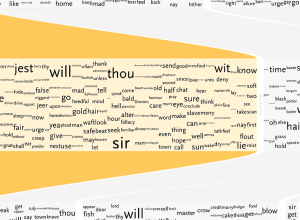
Understanding Shakespeare with visualization
Shakespeare literature is confusing. That’s not even an opinion. It’s a fact. Stephan…
Design advanced online and interactive maps with Polymaps
In a collaboration between SimpleGeo, who makes location data easier to access, and…

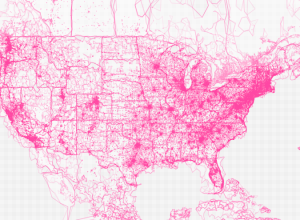
Bus movements in San Francisco animated
Eric Fischer has been having a good bit of fun with maps lately.…
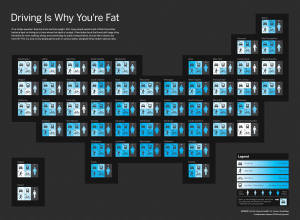
Discuss: Driving is why you’re fat?
In a collaboration between GOOD and Hyperakt, they come out with a bold…
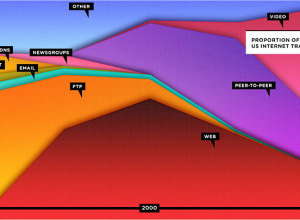
Stacked area shows the Web is dead?
Wired has declared that the Web is dead in their September cover story,…

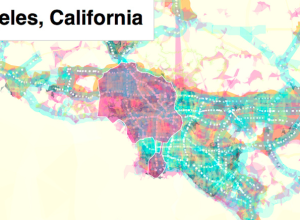
Stamen makes experimental prettymaps
Add another toy to Stamen’s bag of tricks. The recently launched prettymaps by…
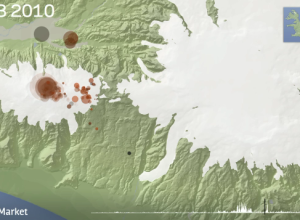
Animated map of earthquakes in Iceland
I’m late on this, but remember that volcano eruption in Iceland a few…
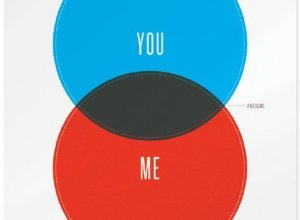
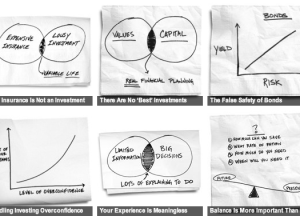
Back-of-the-napkin personal financial advice
Carl Richards, a financial planner and a regular on The New York Times’…

Martin Wattenberg talks data and visualization
Martin Wattenberg, who with his associate Fernanda Viégas, was just snatched up by…