Visualization
Showing the stories in data through statistics, design, aesthetics, and code.

Patterns of daily life in Netherlands from Above
In a similar fashion to their work in Britain from Above, CGI and…

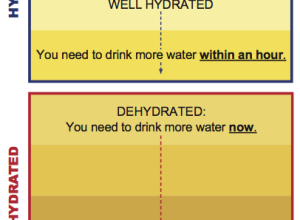
Password reuse visualizer from Mozilla
When you use the same password for every online account, there could be…
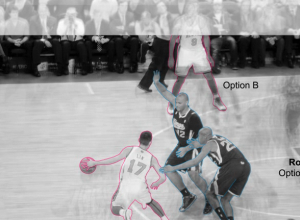
Point guard fundamentals of Jeremy Lin
You knew this was coming, right? The New York Times describes the point…
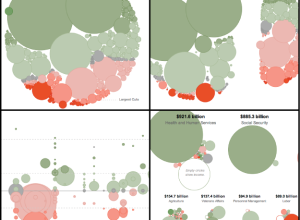
Slicing Obama’s 2013 budget proposal four ways
With Obama’s recent budget for next year proposed, Shan Carter et. al of…


Abstract maps of the United States
Esquire invited a handful of map-makers to represent the United States outside its…
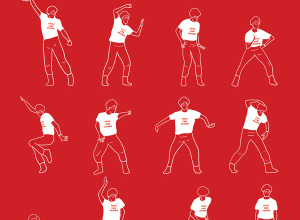
Famous dances in television and cinema illustrated
In a tongue-in-cheek tribute to the Dancing Plague of 1518, Niege Borges illustrates…

Animation shows national migration patterns
Even Westvang uses tax return data to visualize migration patterns of 300,000 Norwegians.…

Tracking the grizzly bear in emotional interactive documentary
In a blend of data and storytelling, Jeremy Mendes and Leanne Allison dig…
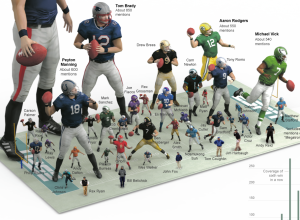
Most mentioned NFL players on SportsCenter
Like something from of a video game, this graphic from The New York…
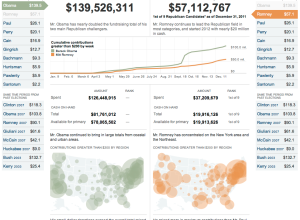
Compare presidential candidate fundraising
Presidential candidates have raised $186 million up to now, according to the Federal…
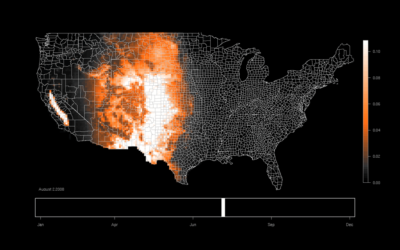
Bird migration patterns mapped
Birds move. eBird shows us how.
Understanding patterns of bird occurrence at continental…
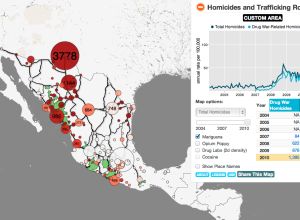
Mapping the drug wars in Mexico
Diego Valle-Jones maps homicides and trafficking routes in Mexico.
To unclutter the map…
Understanding Map Projections →
“a trade between distortion, accuracy, and aesthetics” [via]…
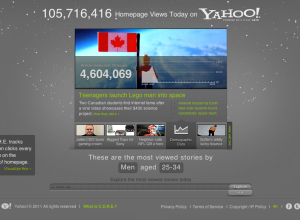
Visualizing popularity of Yahoo homepage stories
Yahoo is not what it used to be, but many parts of it…
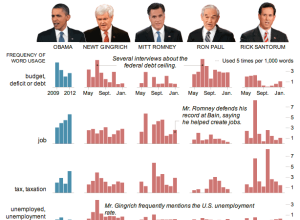
Words used in SOTU and Republican presidential candidates in debates
Jonathan Corum for The New York Times examines word usage by President Barack…