Visualization
Showing the stories in data through statistics, design, aesthetics, and code.
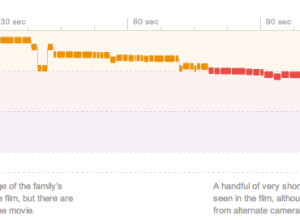
A dissection of movie trailers →
Shan Carter, Amanda Cox, and Mike Bostock for The New York Times, analyzed…
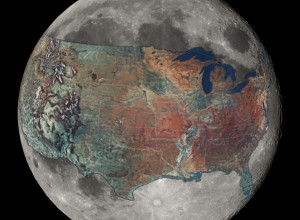
U.S. overlaid on the Moon for a sense of scale
How big is the Moon, really? Reddit user boredboarder8 provided some perspective with…
A shroud of cold air descends on the U.S.
From NOAA, an animation showing a wave of cold during the Martin Luther…
Chart Check: Did Obama’s Graphics ‘Enhance’ His Big Speech? →
Helped out some for this NPR article…
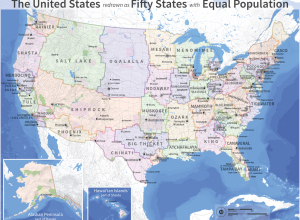
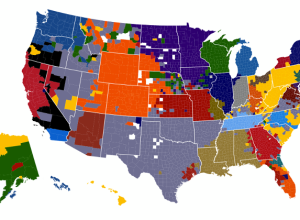
Redrawn United States of electoral votes
Neil Freeman reimagined state boundary lines based on population. He started with an…
Visualization spectrum
A handful of experts weighed in on visualization as a spectrum rather than…
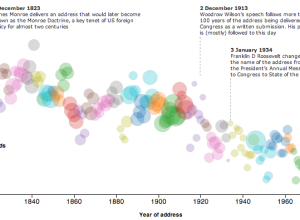
State of the Union address decreasing reading level →
With the State of the Union address tonight, The Guardian plotted the Flesh-Kincaid…
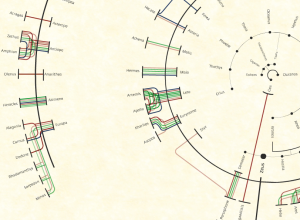
The many relationships of Zeus
Viviana Ferro, Ilaria Pagin, and Elisa Zamarian had a look at all of…
Artists use data to make political statements →
Bringing the human to data…
Mapping translations of Othello
Tom Cheesman of Swansea University, along with Kevin Flanagan and Studio NAND, dives…
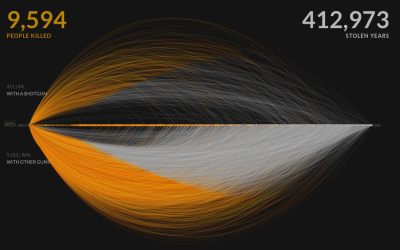
A visual exploration of US gun murders
Information visualization firm Periscopic just published a thoughtful interactive piece on gun murders…
Time running parallel
In Waters Re~ artist Xárene Eskandar placed video of the same landscape at…
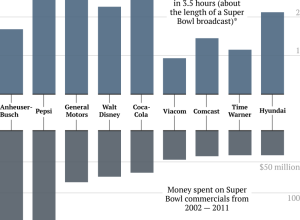
Super Bowl ad costs vs. company profit during game
Ritchie King for Quartz compared money spent on Super Bowl ads — now…
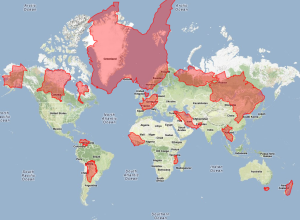
How much is mapping worth →
A comeback for geography…
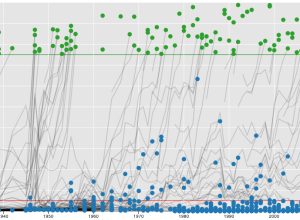
Baseball Hall of Fame voting trajectories
Carlos Scheidegger and Kenny Shirley, along with Chris Volinsky, visualized Major League Baseball…
NFL fans on Facebook, based on likes
As the Super Bowl draws near, Facebook took a look at football fandom…
Ten years of cumulative precipitation
We’ve all seen rain maps for a sliver of time. Screw that. I…