Visualization
Showing the stories in data through statistics, design, aesthetics, and code.
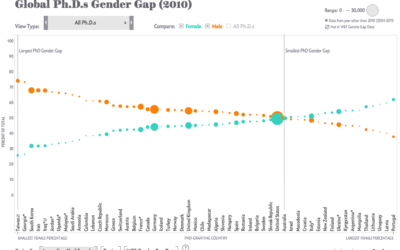
PhD gender gaps around the world
Periscopic, for Scientific American, visualized the number of PhDs awarded in various countries.…

Search for word usage in movies and television over time
Movies and television shows often reflect cultural trends of the time they are…
Powers of Ten, Derek Jeter style
You’ve likely seen the classic Powers of Ten video from 1977. It starts…
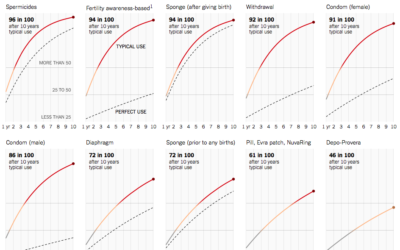
Probabilities of failing birth control methods
In high school health class, where I learned about contraceptives and the dangers…
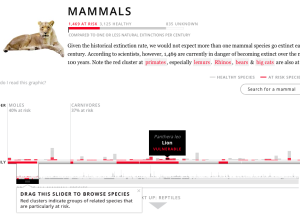
Extinctions and animal species at risk
Data journalist Anna Flagg for ProPublica reported on animal species at higher risk…

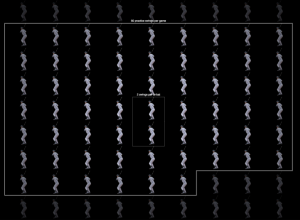
Generative book covers
The New York Public Library is developing an eBook-borrowing system, which includes an…
Beat Blox
Beat Blox is a student project by Per Holmquist from Beckmans College of…
Dinosaurs versus airplane
Scientists found the fossils of a giant dinosaur that they estimate was 26…
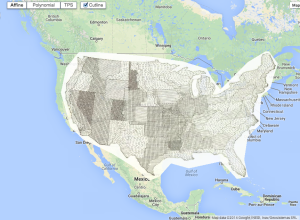
Old maps overlaid on Google Maps
The British Library georeferencing project places old maps, as far back as the…

Style over function for redesigned choking posters
In many parts of the country, the departments of health require that eating…
Cosmic map shows Milky Way at the edge of a supercluster
Nature highlights the research of R. Brent Tully et al, which defines a…
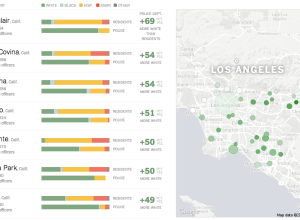
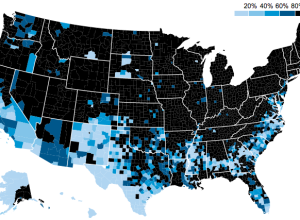
Race distributions of police departments versus residents →
When you compare distributions of race for police departments and for the residents…
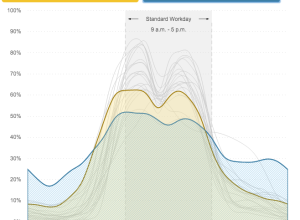
When people work, by job category
In another use of data from the American Time Use Survey, Planet Money…
Segregated schools, still
The map above by MetroTrends shows the percent of white kids who attended…
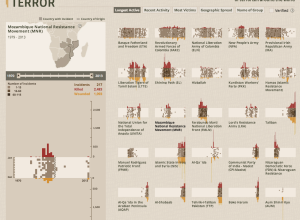
Interactive tool shows impact of terrorism
The Global Terrorism Database, maintained by the University of Maryland, is an open…
Graph-based video game
Last year, Metrico, an infographic-based puzzle game for the PlayStation Vita, was announced…