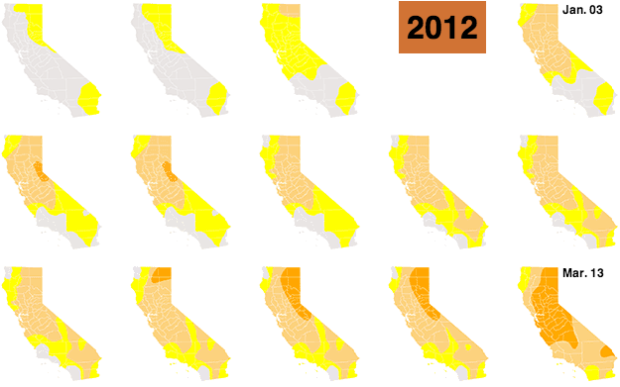
To show the increased levels of drought throughout the state of California, Kyle Kim and Thomas Suh Lauder for the LA Times showed weekly change in drought levels with 188 color-coded California maps. There’s also an animated version, but why do that when you can scrollllll?
A couple of years ago, the New York Times did something similar, but with a two-category color scale and on a national scale.
 Visualize This: The FlowingData Guide to Design, Visualization, and Statistics (2nd Edition)