Projects
Graphics by Nathan Yau, borne out of everyday curiosities, learning experiments, and mild insomnia.
Why learning code for data is worthwhile
There are lots of tools that have come out in the past couple…
Where the aliens are flying their UFOs
I came across some UFO sightings data on Infochimps, from the National UFO…
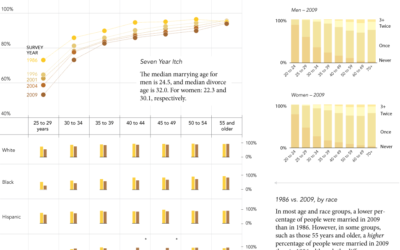
Seven year itch: When do people get married and divorced?
The United States Census Bureau just released results from the Survey of Income…
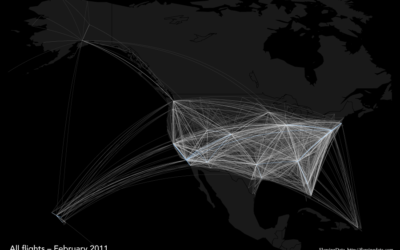
Geographic breakdown: Where do major airlines fly?
Ever since seeing the Facebook friendship map and later, the map of scientific…
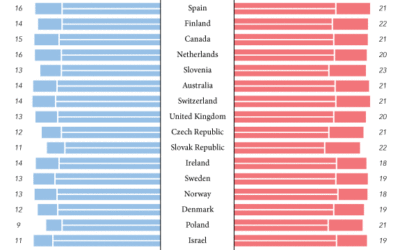
Who spends the most years in retirement?
Early retirement. That’s what most people want, unless you’re lucky enough to love…
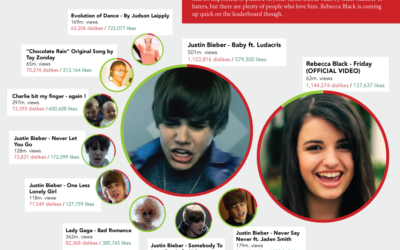
In land of YouTube dislikes, Justin Bieber rules
Happy Friday, everyone. If you’ll allow me, I’d like to take a moment…
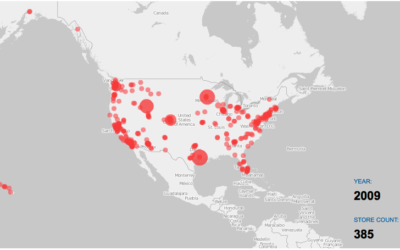
Watching the growth of Costco warehouses
Costco is one of the best stores ever. It’s got everything you need…
States with the most and fewest firearms murders
According to 2009 numbers reported by the Federal Bureau of Investigation, DC, Louisiana,…
Finding Global Agenda Councils who should work together
This past month, the World Economic Forum convened in Dubai to discuss issues…
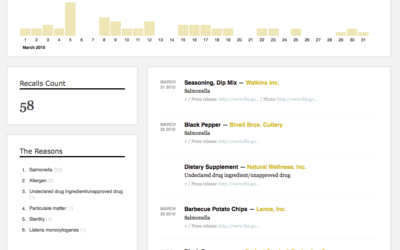
Making recalls and market withdrawals more accessible
Last week I found out that the FDA has a feed for all…


