Projects
Graphics by Nathan Yau, borne out of everyday curiosities, learning experiments, and mild insomnia.
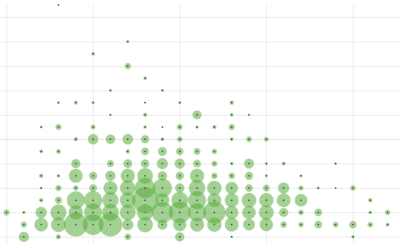
After Marriage, How Long People Wait to Have Kids
First comes love, then comes marriage, then comes baby in the baby carriage. Sometimes.

Baby-Making Age
We looked at prime dating age and when people usually marry. Now it's time for the next step in the circle of life.

Goodbye, Mid-Range Shot
There's a space on the basketball court called "mid-range." It's actually not off-limits. In fact, people used to shoot these so-called "mid-range" shots.
Ages in Congress, from the 1st to the 115th
As I watched Google’s CEO Sundar Pichai field questions from the House Judiciary…
Single-Income Occupations
About 18 percent of couple households are single-income. I wanted to know what the earner in these homes usually do.

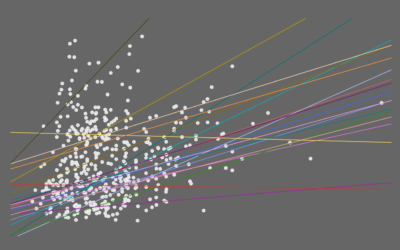
Peak Non-Creepy Dating Pool
Based on the "half-your-age-plus-seven" rule, the range of people you can date expands with age. Combine that with population counts and demographics, and you can find when your non-creepy dating pool peaks.

Growth of Subreddits
As of September 2018, there were 892 million comments for the year so far, spread out over 355,939 subreddits. Here's how it got to this point, and "what the internet has been talking about" during the past 12 years.

Ask the Question, Visualize the Answer
Let's work through a practical example to see how asking and answering questions helps guide you towards more focused data graphics.

Shifting Causes of Death
The most common causes of death changed over the years. They vary across sex and age group. This animation shows the details of these changes.

One Drink Per Day, Your Chances of Developing an Alcohol-Related Condition
While a drink a day might increase your risk of experiencing an alcohol-related condition, the change is low in absolute numbers.

Cuisine Ingredients
What are the ingredients that make each cuisine? I looked at 40,000 recipes spanning 20 cuisines and 6,714 ingredients to see what makes food taste different.

3-D-Printed Time Series Plates
After seeing a 1950s physical visualization, I wondered if I could follow a similar process using modern techniques.
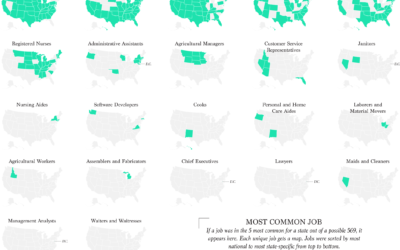
Most Common Jobs, By State
Instead of looking at only the most common job in each state, I found the top five for a slightly wider view.

Warranty Expiration
With almost absolute certainty, every product dies a quick death once its warranty…

Visualizing Patterns on Repeat
Things have a way of repeating themselves, and it can be useful to highlight these patterns in data.