Projects
Graphics by Nathan Yau, borne out of everyday curiosities, learning experiments, and mild insomnia.
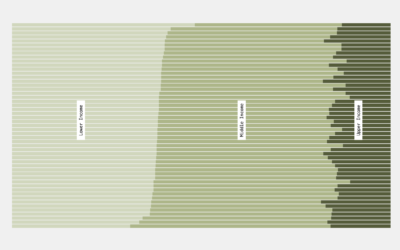
Percentage of Households in Each Income Level
What percentage of households fall into lower-, middle-, and upper-income levels when you adjust for household size?
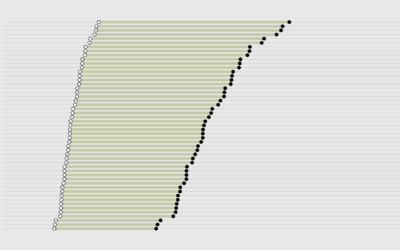
What Qualifies as Middle-Income in Each State (2017)
The meaning of "middle-income" changes a lot depending on where you live and your household size.
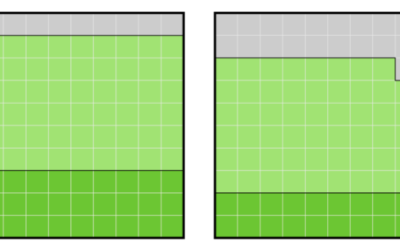
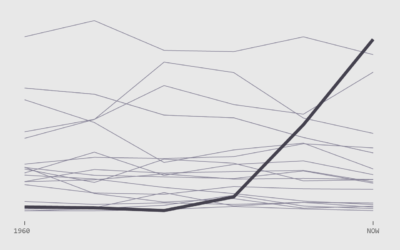
Happiness and Health
When one goes down, so does the other. If only there were a way to keep more people healthy.

The Stages of Relationships, Distributed
Everyone's relationship timeline is a little different. This animation plays out real-life paths to marriage.
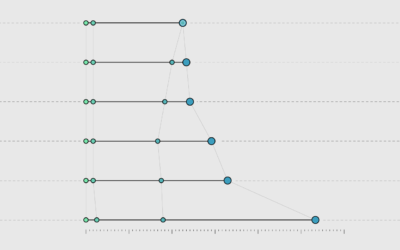
The Relationship Timeline Continues to Stretch
We know that people are marrying later in life, but that's not the only shift. The whole relationship timeline is stretching.
Shifts in How Couples Meet, Online Takes the Top
How do couples meet now and how has it changed over the years? Watch the rankings play out over six decades.

How People Meet Their Partners
"So how'd you two meet?" There's always a story, but the general ways people meet are usually similar. Here are the most common.
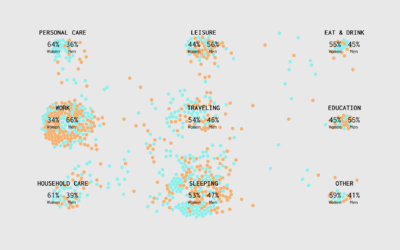
A Day in the Life: Women and Men
Using the past couple of years of data from the American Time Use Survey, I simulated a working day for men and women to see how schedules differ. Watch it play out in this animation.
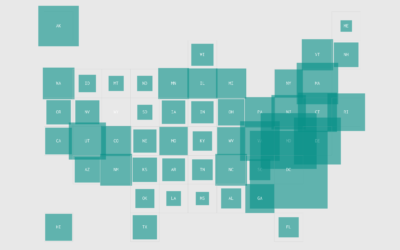
Where Your Job is Most Popular
Some jobs are common nationwide, because they are needed everywhere. Others are more specific to geography. See where job falls on the spectrum.
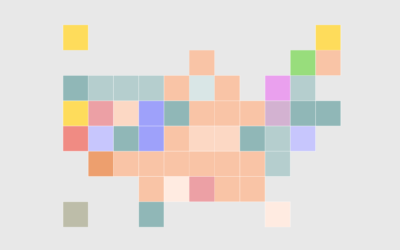
Most Uniquely Popular Job in Each State
These are the jobs in each state that are most specific to the place.
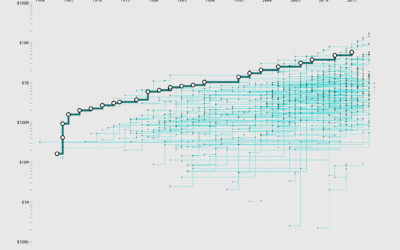
Billions at the Franchise Box Office
There's big money in wizarding worlds, galaxies far away, and various time-shifted universes. Let's take a stroll through the billions of dollars earned by franchises over the years.
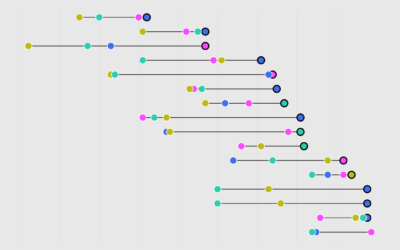
EGOT Winner Timelines
Only 15 people have done it, since you know, it's not really easy to do. Here's how and when they did it.
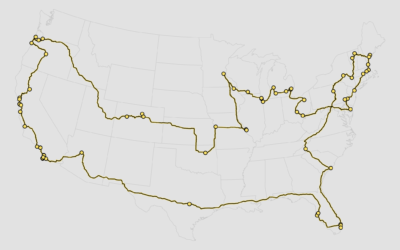
Brewery Road Trip, Optimized With Genetic Algorithm
Visit the best American breweries of 2018, based on RateBeer rankings, while minimizing travel time and distance.
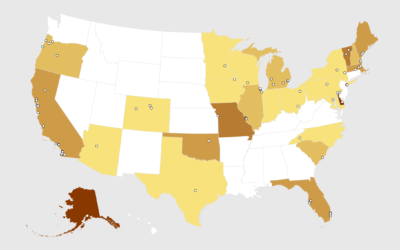
Map of Best Breweries in America, 2018
RateBeer puts out a list every year for top 100 breweries in the world. Here are the states that cracked the list.
How Many Kids We Have and When We Have Them
Many parents stop at two kids. Most are done by three. Still, everyone has their own timelines. Here are 1,000 of them.