Data Underload
People worry about data overload. Fooey. Charts and musings by Nathan Yau.
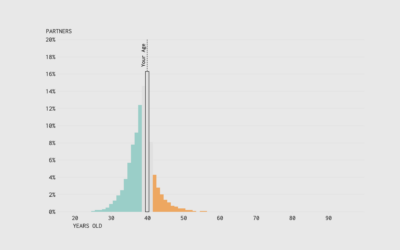
See Who is Older and Younger than You
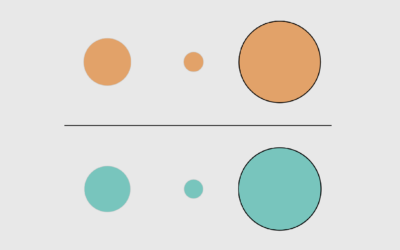
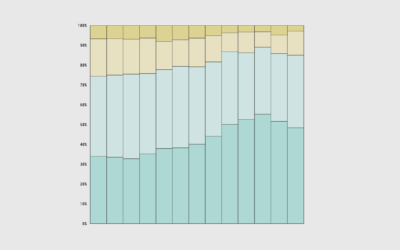
As you get older, it might start to feel like everyone is getting younger around you. At what point are you older than the majority?
Occupation and Salary Rankings, Each Decade Since 1970
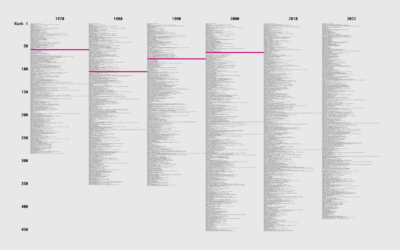
Job types changed over the years, because there were these things called computers that created occupations and shifted others. How did income change for different jobs, relative to everyone else?
Simulation for Probability of Success
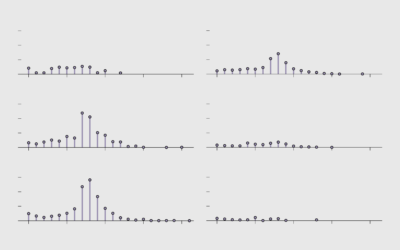
Imagine that you try to do something and there's a 20% chance of success. If you try to do the thing six times, what is the probability that you succeed at least once?
Where the Time Goes with Age
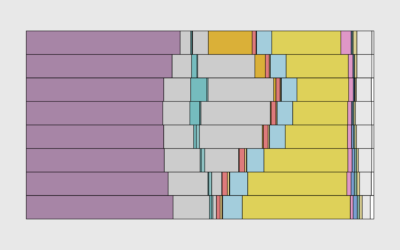
We get 24 hours in a day. How do we spend this time? How does our time use change as we get older and priorities shift?
How Much We Work
In our younger years, we have school and more important things to do, but then we get older and there are bills to pay.
Sleep Hours and Feeling Rested
Two-thirds of adults get at least 7 hours of sleep. I am not in that two-thirds.
Ages of the People We Marry
Variation kicks in when you look at the later years, consider multiple marriages, divorce, separation, and opposite-sex versus same-sex relationships. This chart breaks it all down.
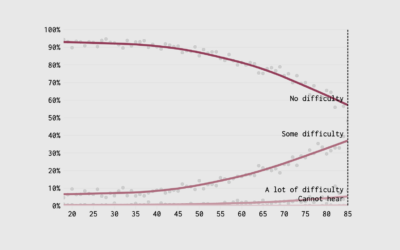
When Your Vision and Hearing Decline with Age
Find out when it's your time for the glasses and hearing aid. Time is undefeated.
Common Age Differences, Married Couples
How common are wide age gaps between spouses? These are the age differences through the lens of the 2022 five-year American Community Survey.
McDonald’s Locations vs. Golf Courses
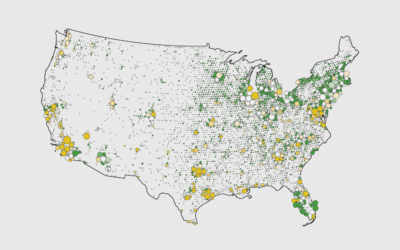
There are thousands of McDonald's locations, but there are still more golf courses in the United States. This seems surprising, but some maps make it clear.
Feeling Rested with Age
How much you sleep each night matters, but more importantly, it's about the quality and if you feel rested when you wake up.
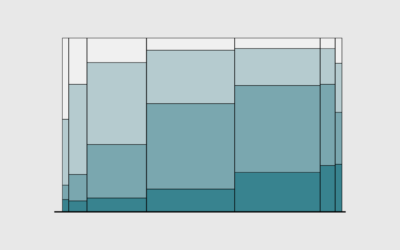
Race and Occupation
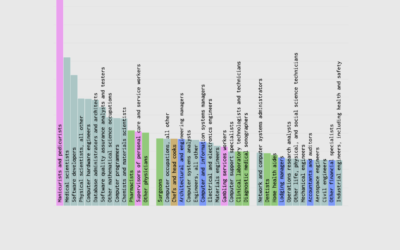
Asian workers are more than three times more likely to be physicians. What other jobs jump out? What's it like for other races and ethnicity?
When and How Many Super Bowl Wins, by Team
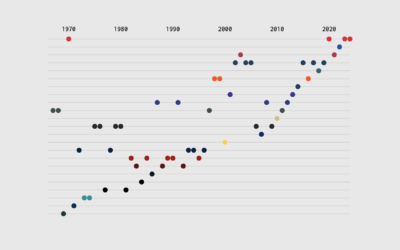
How does the modern Kansas City Chiefs compare to teams who won previous Super Bowls over the past 58 years?
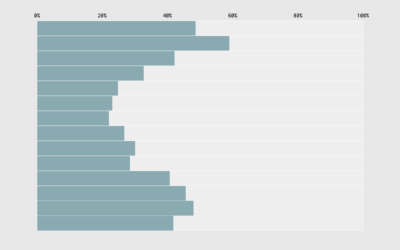
Commonness of Races in Different Occupations
Some occupations are more race-dominant than others. This is the percentage of employed persons 16 years and older who are a given race or ethnicity for each.

