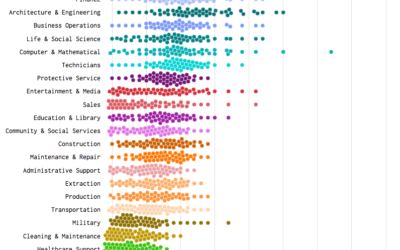
Oldest, Youngest, and Middle Children, in Differently Sized U.S. Households
When talking to someone new, the conversation often leads to your family when you were growing up. Do you have siblings? Older than you? Younger? I thought I’d try answering the questions for everyone in the United States. The chart below shows the distribution of kids younger than 18 by birth order and number of kids in the household.
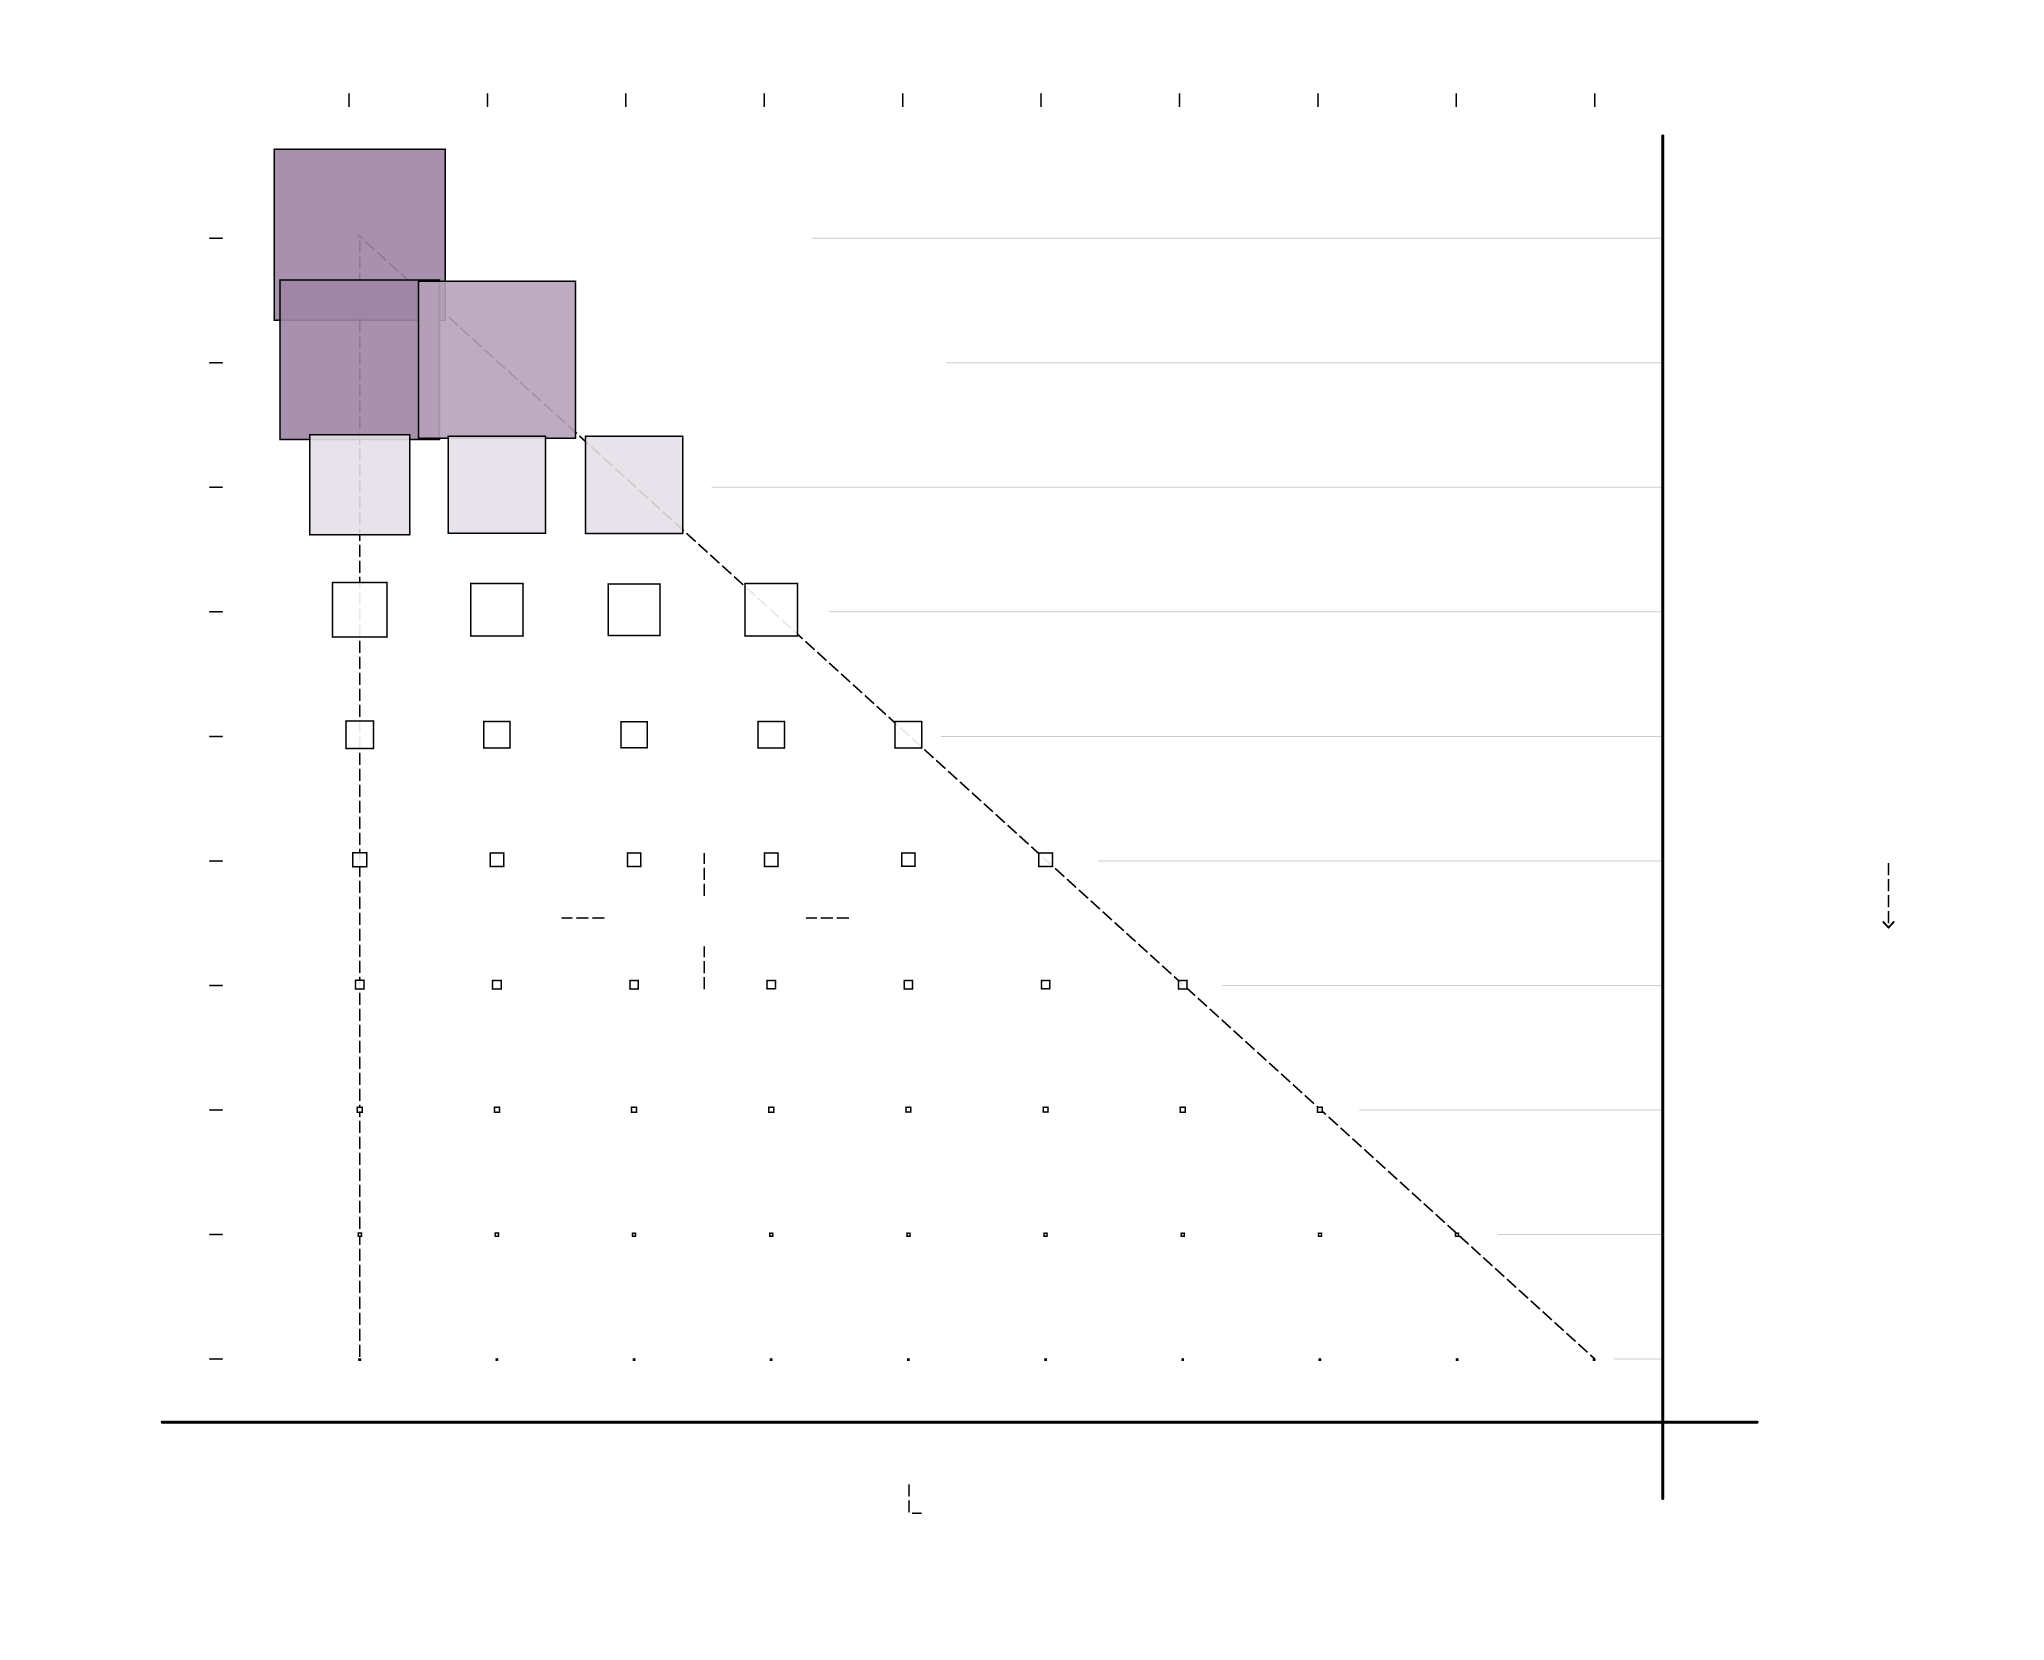
BIRTH ORDER
1st
2nd
3rd
4th
5th
6th
7th
8th
9th
10th
KIDS IN THE
HOUSEHOLD
HOUSEHOLD TOTAL
PERCENTAGE
About 23% of kids were the only child in the household.
23%
1
23%
20% of kids were the oldest of two and 20% were the youngest of two.
2
It was most common to have two kids in the household.
20%
20%
40%
3
8%
8%
8%
23%
4
9%
2%
2%
2%
2%
YOUNGEST KIDS
Households with more than four children was increasingly more rare.
5
3%
1%
1%
1%
1%
1%
Out of kids with siblings, 40% were the youngest.
6
1%
OLDEST
KIDS
MIDDLE KIDS
7
<1%
Out of kids with siblings, 41% were the oldest.
8
<1%
Middle children unite.
9
<1%
10
<1%
55%
30%
11%
3%
1%
<1%
<1%
<1%
<1%
<1%
About 1% of kids were the fifth born.
BIRTH ORDER TOTAL PERCENTAGE
SOURCE: Current Population Survey, 2017–2021
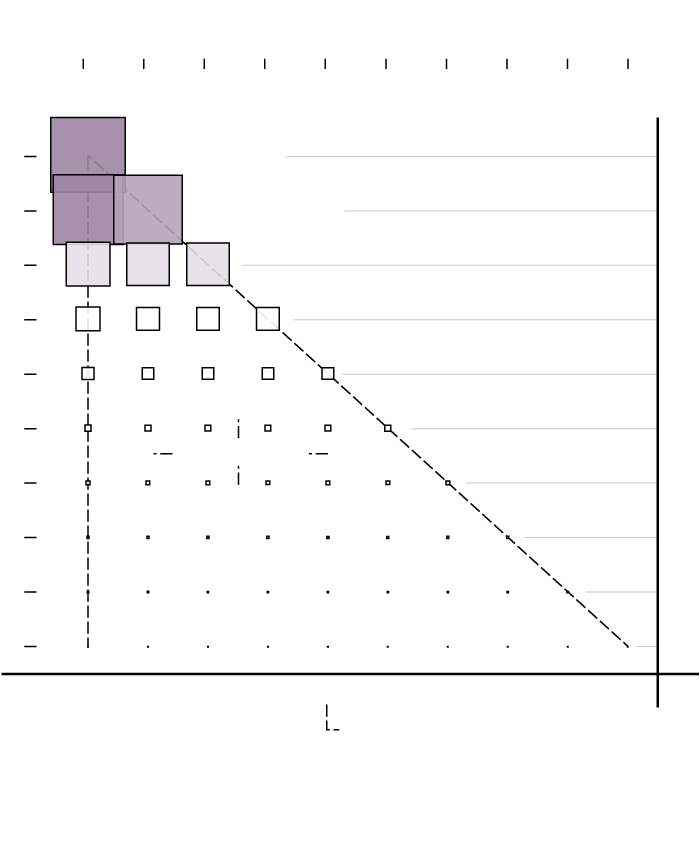
BIRTH ORDER
1st
2nd
3rd
4th
5th
6th
7th
8th
9th
10th
KIDS IN HOUSEHOLD
HOUSEHOLD TOTAL PCT.
About 23% of kids were the only child in the household.
23%
1
23%
20% of kids were the oldest of two and 20% were the youngest of two.
2
40%
20%
20%
3
23%
8%
8%
8%
4
9%
2%
2%
2%
2%
YOUNGEST KIDS
5
3%
1%
1%
1%
1%
1%
Out of kids with siblings, 40% were the youngest.
6
1%
OLDEST
KIDS
MIDDLE KIDS
7
<1%
8
<1%
Out of kids with siblings, 41% were the oldest.
Middle children unite.
9
<1%
10
<1%
55%
30%
11%
3%
1%
<1%
<1%
<1%
<1%
<1%
About 1% of kids were the fifth born.
BIRTH ORDER
TOTAL PCT.
SOURCE: Current Population Survey, 2017–2021
This is based on the Current Population Survey between 2017 through 2021. The main caveat is that we only know the number of kids younger than 18 in the household, which means we don’t know the full family makeup of every household.
For example, a family with three kids but one who doesn’t live at home will count towards two kids in the household. So we only know the distribution of kids in the household during the time of the survey.
That said, the results seem to make sense. You see households with five or fewer kids cover about 98% of the households with at least one kid. Larger families appear to be more rare, maxing out at ten kids in the sample.
Notes
The data comes from the Current Population Survey from 2017 through 2021. I used microdata downloaded via IPUMS from March of each year.
Chart Type Used

Become a member. Support an independent site. Get extra visualization goodness.
See What You Get