Percentage of Households in Each Income Level
Now that we know the cutoffs that make lower-, middle-, and upper-income in each state, we can estimate the percentage of households in each income level. Adjust for people in the household and sort states by highest percentages in the income levels.
Household Income Level Breakdown
Bars represent lower-, middle-, and upper-income percentages for each state.
The data comes from the 5-year American Community Survey from 2017. Middle-income is defined as two-thirds the median income for a group to twice the median. Lower-income is everything below the former, and upper-income is everything greater than the latter.
It’s interesting to see the breakdowns for the one-person households. The relatively high percentages for the upper-income level at or greater than the 50% mark seems to suggest a lot of clustering towards the higher end. Increase the household size, and the upper-income percentages go down to the teens.
I suspect employment, occupations, and family makeup play a big role in the variation. Gonna have to look at that next.
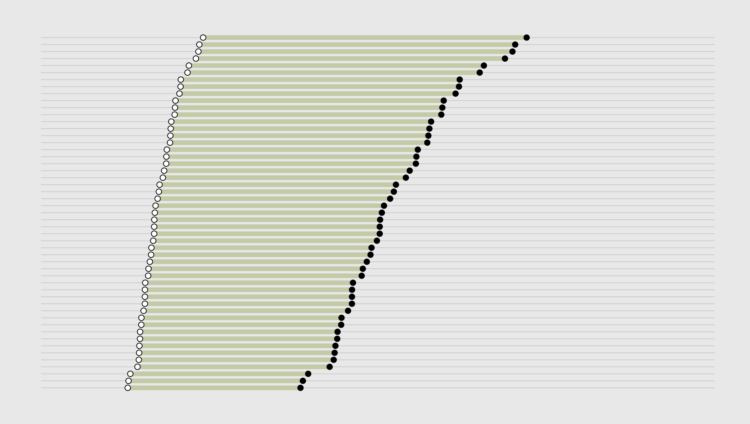
What Qualifies as Middle-Income in Each State
See how income ranges change for each state.
Notes
Chart Type Used

Become a member. Support an independent site. Get extra visualization goodness.
See What You Get