Income Sources
Most people have a job and receive wages in return, but that starts to change when you get into the higher income groups. We turn to the 2021 American Community Survey (ACS) to see how income sources can vary.
Let’s say this square represents one hundred dollars:

Equals $100
If someone makes $10,000 in a year, we represent the year’s income with 100 squares (10,000 divided by 100).
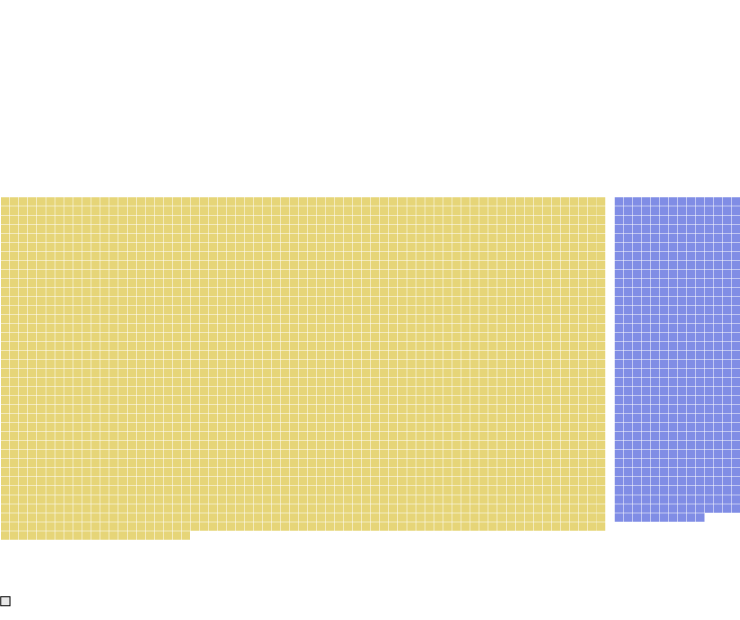
Here’s the income for an aircraft technician in the ACS sample:

An Aircraft Technician
$45,000 income in a year
Equals $100
100% from wages

An Aircraft Technician
$45,000 income in a year
100% from wages
Equals $100
That’s 450 squares, which represents $45,000 in wages. So if someone makes $100,000 in a year like the sales representative below, we use one thousand squares:

A Sales Representative
$100,000 income in a year
Equals $100
100% from wages

A Sales Rep.
$100,000 income in a year
100% from wages
Equals $100
The aircraft technician and sales representative both earned all of their income from wages.
Here’s a manager who earned $300,000, but 83% of it was in wages and the remainder came from business or self-employment:

A Manager
$300,000 income in a year
Equals $100
83%
from wages
17%
business
A Manager
$100,000 income in a year
83%
from wages
17%
business
Equals $100
That’s two income sources with wages and a business. ACS provides six more classifications for a total of eight income sources:

EACH SQUARE REPRESENTS $100 OF INCOME
Wages
Business
Investments
Retirement
Social Security
Welfare
SSI
Other

EACH SQUARE REPRESENTS $100
Wages
Business
Investments
Retirement
Social Security
Welfare
SSI
Other
Wages are money received as an employee; business income is self-employment income from one’s own business or farm; investment income comes from interest, dividends, and rents; retirement income is from pension or retirement accounts, not including Social Security; Social Security is income from Social Security; welfare income is from public assistance programs; Supplemental Security Income (SSI) is government-funded and based on need; and the other category is for any income that doesn’t fall in the defined categories.
Knowing that people spend money differently when income varies, I wondered how people earn money differently. Below shows the average percentage and amount, by income group:

Income Sources On Average, By Income Group
EACH SQUARE REPRESENTS $100 OF INCOME
Wages
Business
Investments
Retirement
Social Security
Welfare
SSI
Other
INCOME GROUP
Supplemental Security Income (SSI), a need-based program, is more common among low-income groups, as should be expected.
$0 to $14,999
83%
$15,000 to $29,999
86%
$30,000 to $49,999
90%
$50,000 to $74,999
Most people’s income comes completely from earned wages through a job.
91%
$75,000 to $99,999
91%
$100,000 to $199,999
With higher income, it grows more common to earn money in other categories besides wages, such as a personal business or investments.
90%
$200,000 to $299,999
87%
$300,000+
Those with the highest incomes tend to have high wages, but on average, about a quarter of income comes from elsewhere.
75%
15%
9%

Income Sources On Average, By Income Group
EACH SQUARE REPRESENTS $100 OF INCOME
Wages
Business
Investments
Retirement
Social Security
Welfare
SSI
Other
Supplemental Security Income (SSI), a need-based program, is more common among low-income groups, as should be expected.
INCOME GROUP
$0 to $14,999
83% from wages
$15,000 to $29,999
86%
$30,000 to $49,999
90%
Most people’s income comes completely from earned wages through a job.
$50,000 to $74,999
91%
$75,000 to $99,999
91%
With higher income, it grows more common to earn money in other categories besides wages, such as a personal business or investments.
$100,000 to $199,999
90%
$200,000 to $299,999
87%
Those with the highest incomes tend to have high wages, but on average, about a quarter of income comes from elsewhere.
$300,000+
75%
15%
9%
People who make the big bucks appear to be more likely to earn income from their own business and investments, in addition to an employee salary.
But keep in mind that the above shows averages. If you take the average of a person who makes all their income from a business and a person who makes all their money from a salary, then the average looks like a half-half split between business and salary. It’s probably more likely that someone either earns income from a salary or a business and that gets supplemented by investments.
You can kind of see this in a sample of individuals’ incomes:

Income Sources for Different People
EACH SQUARE REPRESENTS $100 OF INCOME
Wages
Business
Investments
Retirement
Social Security
Welfare
SSI
Other
Housekeeper
Not working
Not working
Fast food
Stocker
Sales
$1,000
$1,300
$1,500
$1,800
$3,000
$5,000
100%
100%
100%
100%
100%
100%
Gambling svc.
Not Working
Cook
Not working
Not working
Fast food
$5,600
$5,800
$7,800
$8,400
$9,000
$10,000
100%
62%
38%
100%
100%
100%
100%
Cashier
Business operations
Cook
Not working
Not working
Not working
$11,000
$11,600
$12,300
$14,400
$15,000
$15,200
100%
16%
84%
100%
100%
100%
52%
48%
Not working
Not working
Not working
Fast food
Registered nurse
Laborer
$15,400
$15,600
$16,800
$18,800
$20,000
$20,800
39%
61%
100%
100%
11%
89%
100%
100%
Childcare
Not working
Entertainer
Stocker
Not working
Not working
$22,800
$22,900
$23,000
$23,700
$24,200
$26,800
100%
87%
13%
65%
35%
38%
62%
96%
33%
67%
Tractor operator
Not working
Production
Production manager
Technologist
Construction
$28,000
$28,000
$29,000
$30,000
$30,000
$30,000
100%
29%
71%
100%
100%
100%
100%
Maid
Janitor
Stocker
Not working
Not working
Lawyer
$30,000
$31,000
$31,200
$31,700
$31,800
$36,200
100%
100%
100%
28%
52%
21%
15%
60%
25%
100%
Billing clerk
Not working
Secretary
Registered nurse
Payroll
Accounting clerk
$37,000
$37,100
$37,900
$40,000
$41,000
$42,000
100%
23%
69%
92%
90%
85%
15%
100%
Personal care aide
Bus driver
Inspector
Customer service
Manager
Elementary teacher
$42,900
$46,000
$48,000
$50,000
$51,000
$50,000
58%
34%
48%
52%
100%
100%
100%
100%
Postsec. teacher
Maintenance
Business ops.
Maintenance
Registered nurse
Librarian
$51,200
$53,000
$55,000
$57,200
$58,000
$60,000
29%
41%
30%
66%
34%
100%
87%
13%
100%
100%
Order filler
Financial clerk
Customer service rep.
Chief executive
Not working
Lawyer
$60,000
$65,000
$65,900
$66,000
$73,200
$75,000
100%
100%
62%
38%
18%
41%
41%
60%
40%
100%
Mechanic
Sales manager
Retail supervisor
Postsecondary teacher
Medical scientist
Manager
$80,000
$80,000
$90,000
$90,000
$91,000
$93,200
100%
50%
50%
100%
78%
22%
100%
100%
Nurse practitioner
Production supervisor
Accountant
Audiologist
Not working
Not working
$93,800
$96,000
$100,000
$101,000
$102,500
$129,890
91%
100%
100%
100%
67%
23%
93%
Manager
Postsecondary teacher
Transport. manager
Property manager
Software developer
Paralegal
$130,000
$150,000
$205,200
$220,000
$310,000
$379,800
100%
100%
84%
16%
55%
45%
94%
96%

Income Sources for Different People
EACH SQUARE REPRESENTS $100
Wages
Business
Investments
Retirement
Social Security
Welfare
SSI
Other
Housekeeper
Not working
Not working
$1,000
$1,300
$1,500
100%
100%
100%
Gambling svc.
Not working
Cook
$5,600
$5,800
$7,800
100%
62%
38%
100%
Cashier
Business ops.
Cook
$11,000
$11,600
$12,300
100%
16%
84%
100%
Not working
Not working
Not working
$15,400
$15,600
$16,800
39%
61%
100%
100%
Childcare
Not working
Entertainer
$22,800
$22,900
$23,000
100%
87%
13%
65%
35%
Tractor operator
Not working
Production
$28,000
$28,000
$29,000
100%
29%
71%
100%
Maid
Janitor
Stocker
$30,000
$31,000
$31,200
100%
100%
100%
Billing clerk
Not working
Secretary
$37,000
$37,100
$37,900
100%
23%
69%
92%
Personal care
Bus driver
Inspector
$42,900
$46,000
$48,000
58%
34%
48%
52%
100%
Postsec. teacher
Maintenance
Business ops.
$51,200
$53,000
$55,000
29%
41%
30%
66%
34%
100%
Order filler
Financial clerk
Customer svc.
$60,000
$65,000
$65,900
100%
100%
62%
38%
Mechanic
Sales manager
Retail spvsr.
$80,000
$80,000
$90,000
100%
50%
50%
100%
Nurse prac.
Production spvsr.
Accountant
$93,800
$96,000
$100,000
91%
100%
100%
Manager
Postsec. teacher
Transport. manager
$130,000
$150,000
$205,200
100%
100%
84%
16%
People only list their primary occupation, so the property manager who earned $220,000 likely has another job which may or may not be related to property management.
You can probably see though that most people’s income is from wages. For those who don’t work, Social Security and retirement income come into play.
Finally, most people do not earn from investments, but those who reported non-zero investment income seem to earn a significant portion of their income in this way. Maybe we’re looking at survivorship bias? We don’t see those who invested but did not earn. However, out of those who reported non-zero investment income, only five percent reported a loss for the year, so take that information as you like. And of course those with higher salaries have more to set aside after paying for essentials.
For the other side of the coin, see how people spend their money.
Become a member. Support an independent site. Make great charts.
See What You GetFlowingData is made possible by supporting members. Since 2007, I, Nathan Yau, a real person, have been analyzing and visualizing data to help more people understand and appreciate it in their everyday lives.
If you liked this or want to make similar data things, please consider supporting this small corner of the internet. You get unlimited access to visualization courses, tutorials, and extra resources. Thanks. — Nathan
Chart Types Used

