Cycle of Many, a 24-hour snapshot for a day in the life of Americans
Available as a limited edition print. Order through the FlowingData shop.

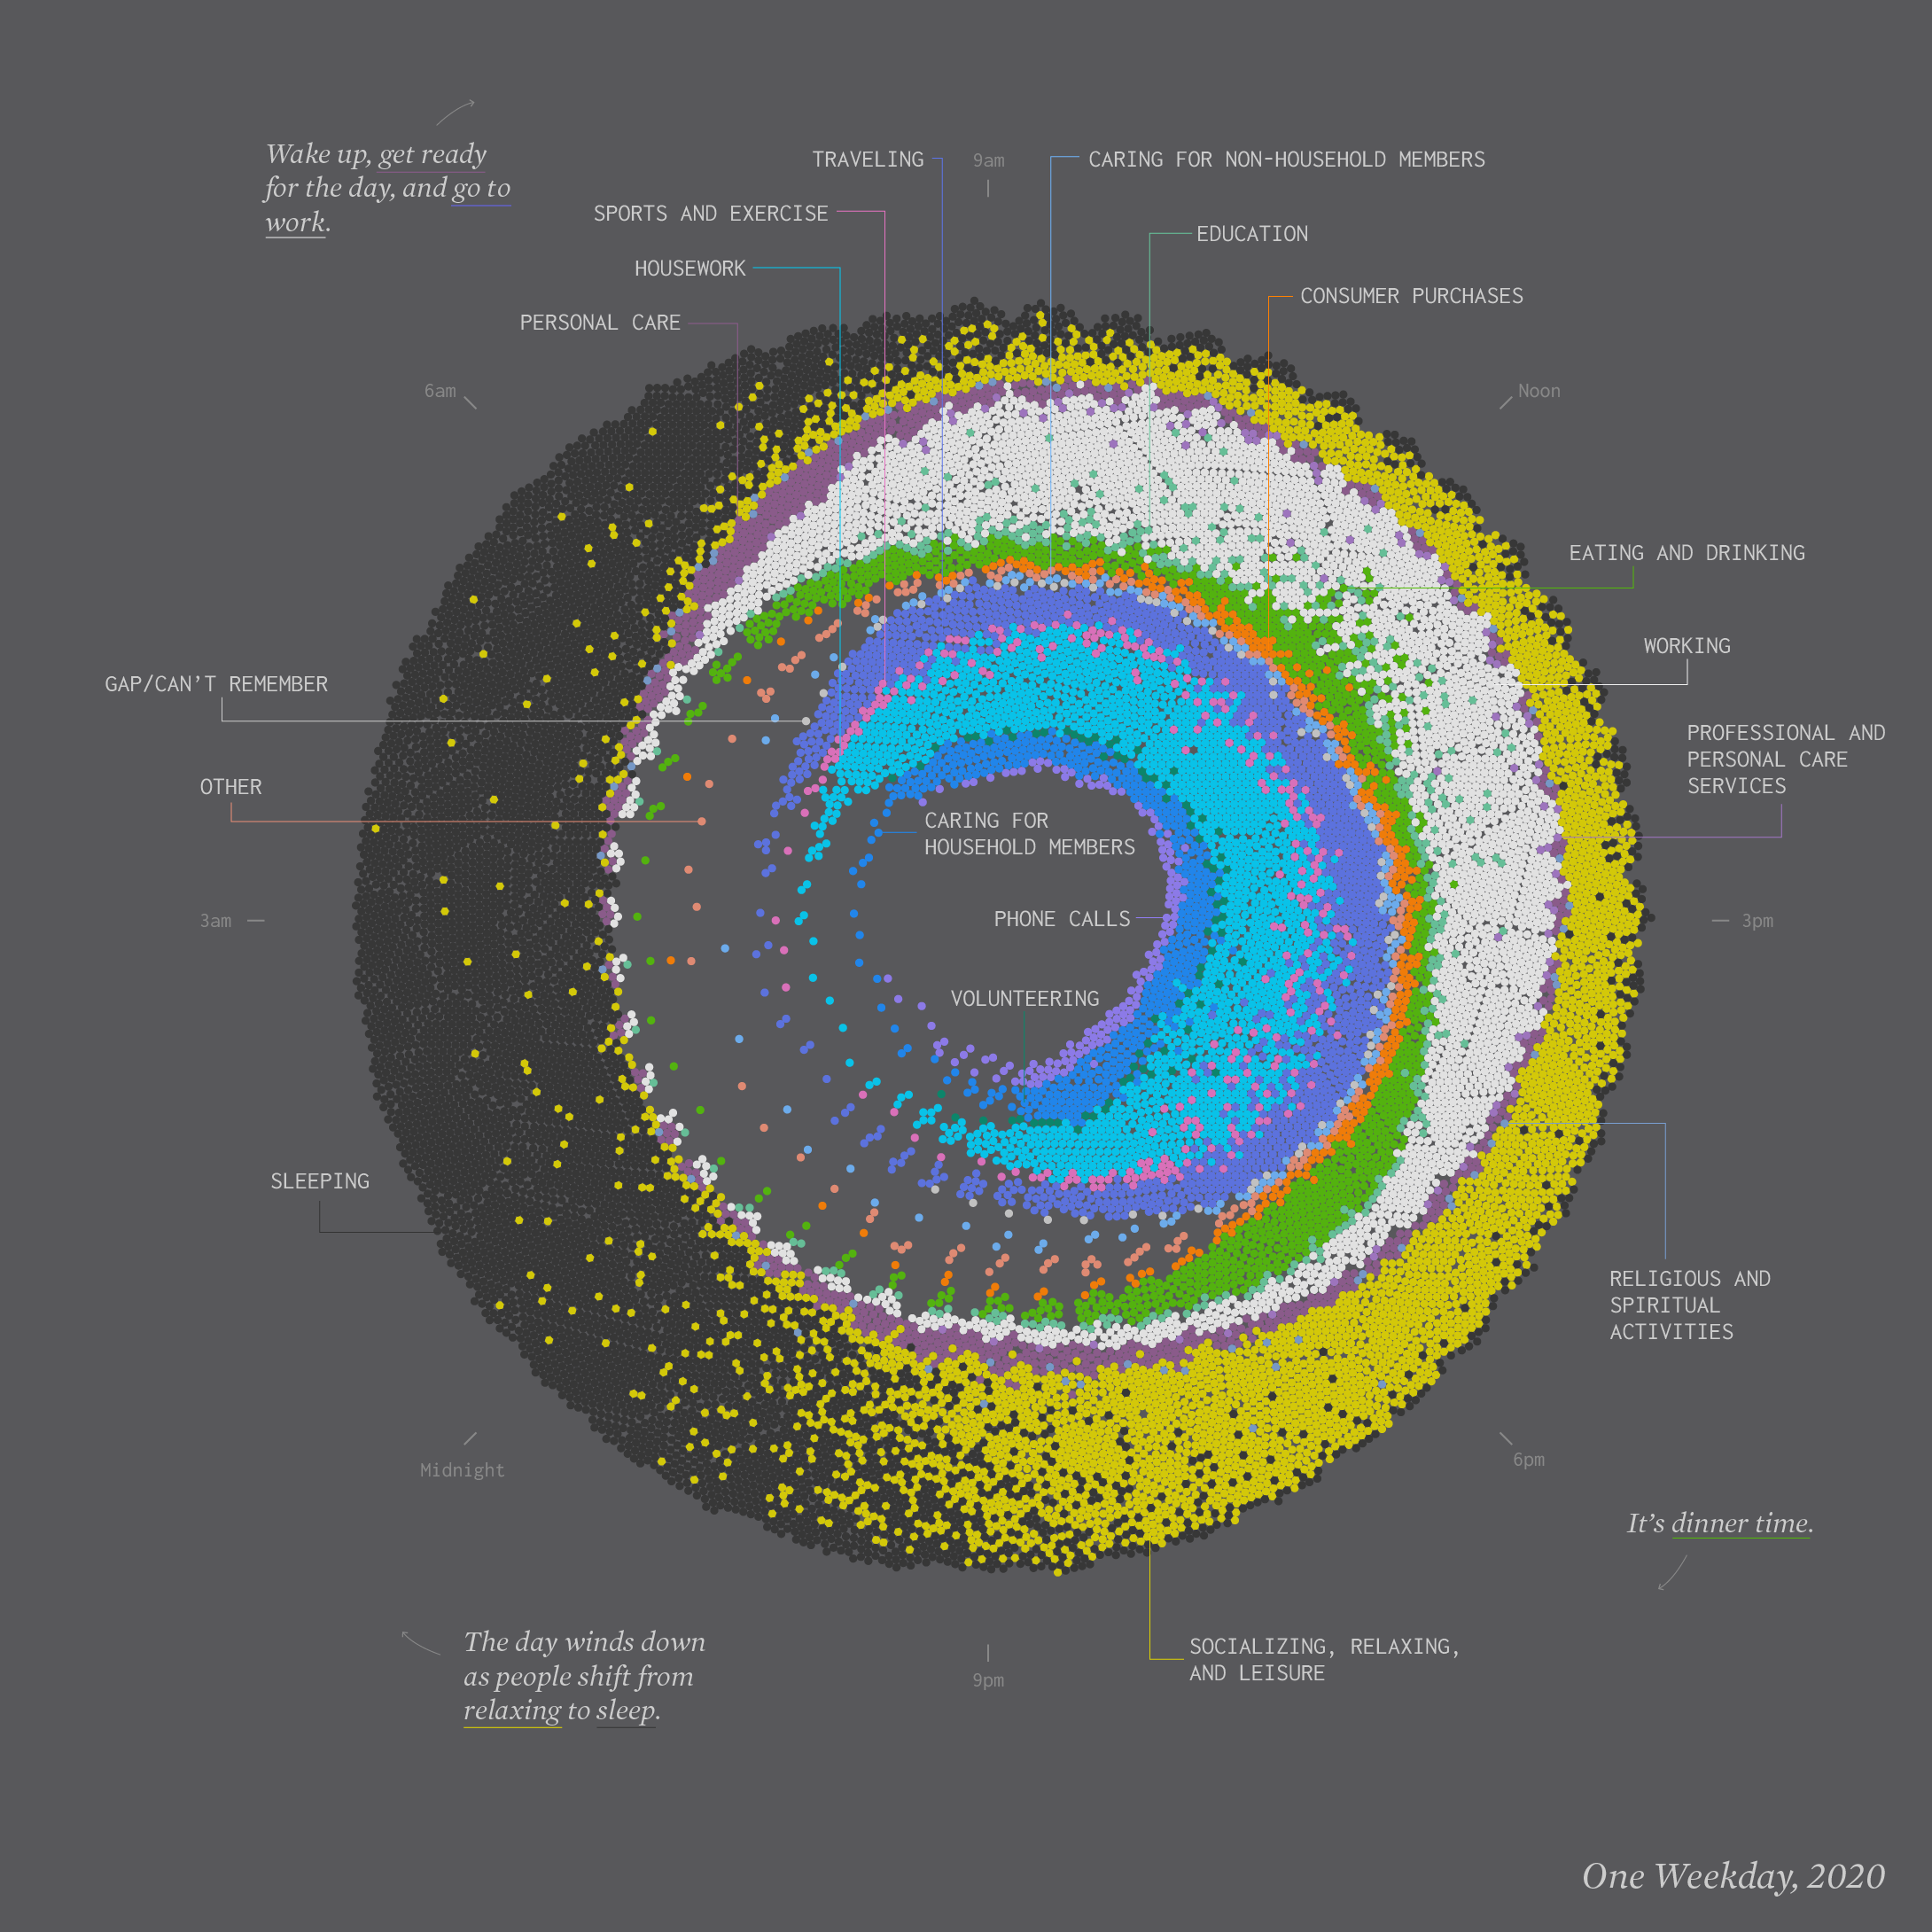
This is a 24-hour snapshot for a day in the life of Americans. Each ring represents an activity with a color. More dots means a greater percentage of people doing the respective activity during a certain time of day.

If you start at the top of the circle, you’ll be at 9:00am when most people who work are already working. Move clockwise, and you see the flows of the day. People break for lunch at noon, get off work around 5:00pm, shift to dinner and then relax. Most people are sleeping by midnight but a small percentage of people are work at night.

Focus on the inside rings versus the outer rings for a rough comparison between work life and home life, each with its own responsibilities.

Source

The data comes from the American Time Use Survey 2020, which is run by the Bureau of Labor Statistics. I downloaded microdata via IPUMS.


Become a member. Support an independent site. Make great charts.

See What You Get

Favorites

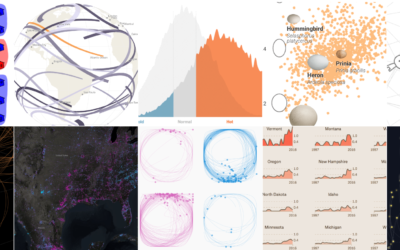
10 Best Data Visualization Projects of 2017

It was a rough year, which brought about a lot of good work. Here are my favorite data visualization projects of the year.

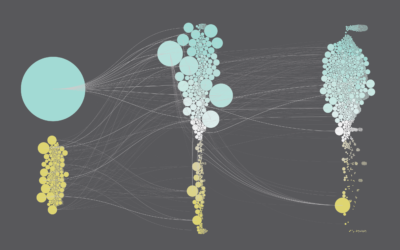
Counting Happiness and Where it Comes From

Researchers asked 10,000 participants to list ten things that recently made them happy. I counted and connected the dots.

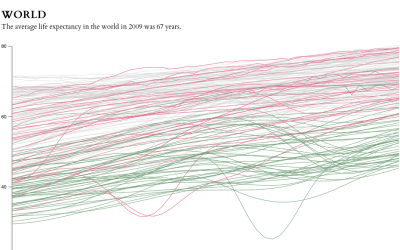
Life expectancy changes

The data goes back to 1960 and up to the most current estimates for 2009. Each line represents a country.

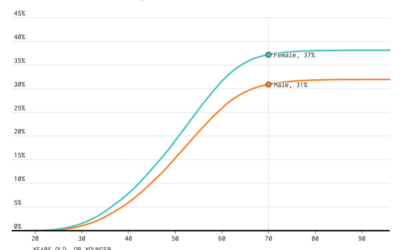
Divorce Rates for Different Groups

We know when people usually get married. We know who never marries. Finally, it’s time to look at the other side: divorce and remarriage.